Retail void analysis compares the retailers or categories present in a trade area with a relevant benchmark to identify where supply appears lower than expected. Retailers use it to screen expansion markets, while landlords and brokers use it to identify potential tenants.
But a missing retailer is not automatically evidence of unmet demand. A category may be absent because customers are underserved, or because demand is weak, consumers shop elsewhere, the market boundary is wrong, or the market cannot support another location.
That makes retail void analysis most useful as a market-screening method. It identifies where to investigate, not where to automatically open the next store.
Key Takeaways
- A missing retailer does not prove unmet demand. Retail void analysis identifies markets worth investigating, not locations where a new store is guaranteed to succeed.
- The comparison determines the result. Use realistic trade areas, comparable benchmark markets, current business-location data, and an appropriate demand measure rather than comparing raw store counts.
- An apparent void is not a recommended store count. A calculation suggesting three missing locations signals a potential supply gap, not proof that the market can support three new stores.
- Validate the opportunity through five tests: demand, catchment reach, competitive capture, network overlap, and site feasibility.
- Move from market screening to site-level evaluation. Before committing to a location, assess accessibility, cannibalization, operating economics, and expected performance.
Retail Void Analysis Answers Different Questions for Retailers and Landlords
The meaning of a retail void depends on who is running the analysis.
| User | Starting question | Typical output |
| Retailer or expansion team | Where is my category or brand underrepresented? | Markets worth evaluating for expansion |
| Landlord or broker | Which retailers or categories are missing from this trade area? | Potential tenant targets |
For a retailer, the objective is usually to identify markets where existing supply appears low relative to potential demand. For a property owner, the same analysis can identify brands or categories that could strengthen the tenant mix.
Both start with the same principle: compare what exists in a market with what would reasonably be expected.
How to Do a Retail Void Analysis
A reliable void analysis requires more than counting stores. The result depends on the trade area, reference market, demand denominator, and quality of the underlying business-location data.
1. Define the Trade Area
Start with the geography that actually represents the market.
That could be:
- A fixed radius
- A drive-time area
- An observed customer-origin area
- A modeled catchment
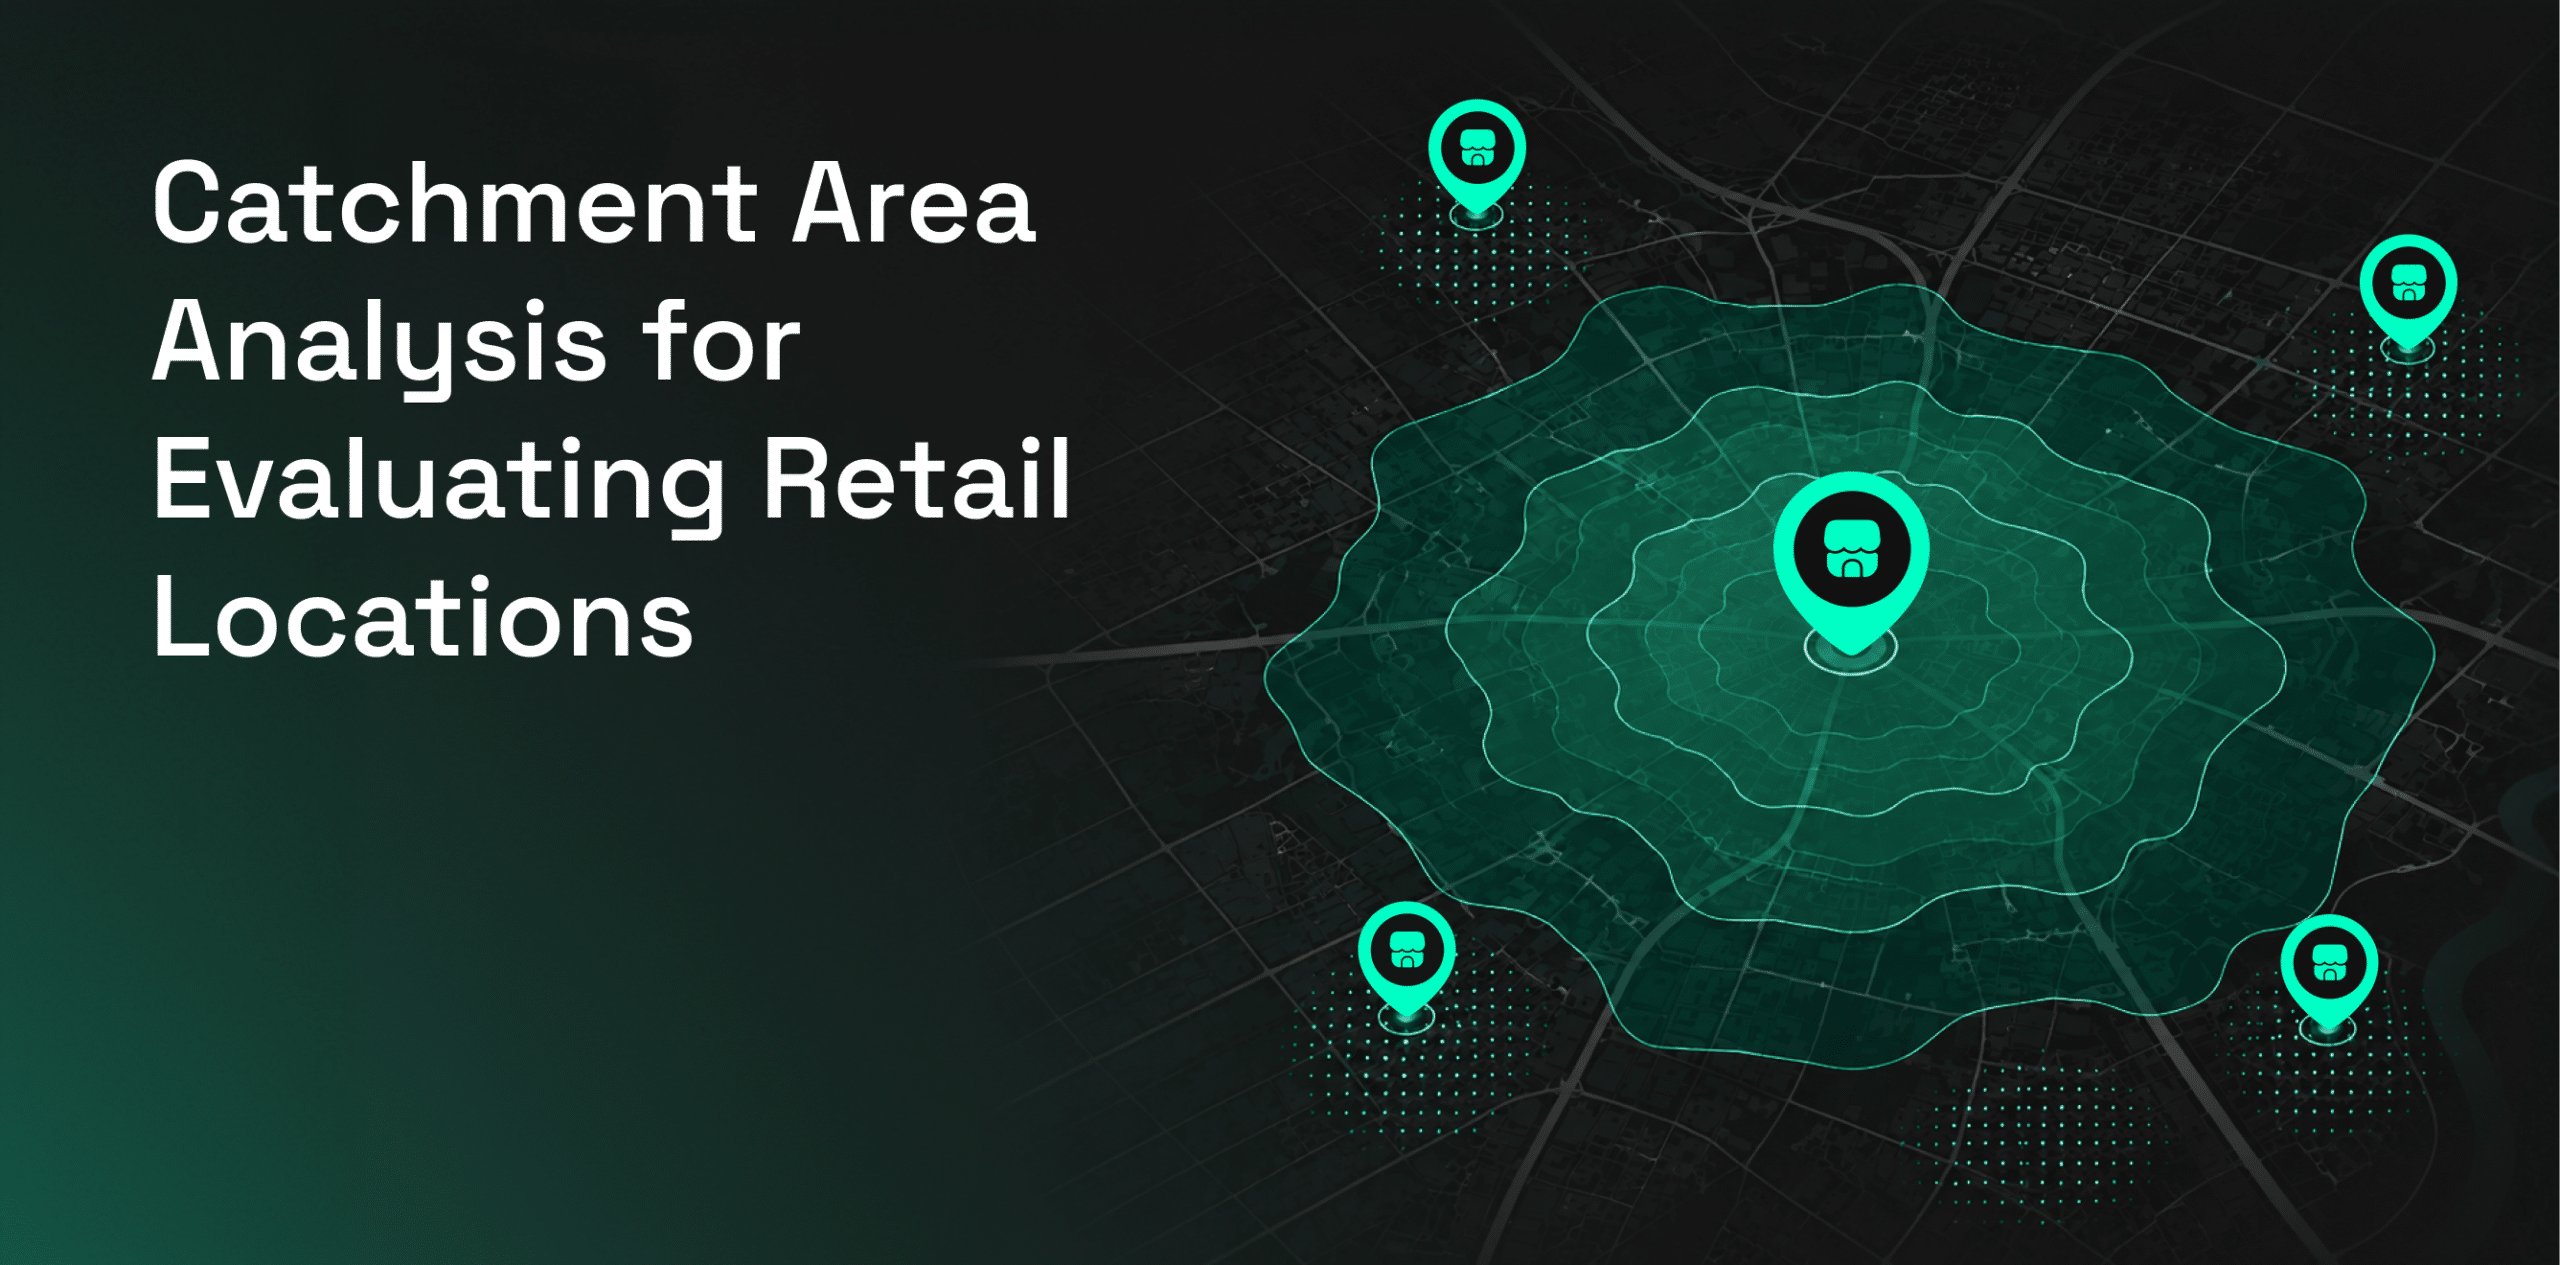
The boundary determines which consumers, competitors, and businesses are included. That makes trade area analysis an important step before the final void is calculated.
A three-mile radius may contain households separated from a location by highways or other barriers while excluding consumers slightly farther away with easier access.
This principle also appears in Esri’s void-analysis methodology, which starts by defining an analysis area and a reference area and supports normalization when the two areas differ in size.
2. Choose a Relevant Benchmark
A market only appears under- or over-supplied relative to something else.
Possible reference markets include areas with:
- Similar population or household counts
- Similar urban or suburban characteristics
- Comparable retail formats
- Similar category demand
- Existing stores that perform well for the brand
Comparing a suburban retail corridor with a dense downtown district may produce a large apparent void simply because the two markets support different store densities.
The benchmark should reflect the kind of market the retailer actually wants to replicate.
3. Measure Existing Supply
Next, determine which businesses already operate inside the trade area.
Useful fields include:
- Brand
- Category
- Location
- Store count
- Shopping centers and anchors
- Open or closed status
- Nearby competing destinations
Freshness matters. A stale business database can continue counting closed stores or miss recent openings, changing the apparent size of the void.
Detailed POI data is particularly important here because category errors, duplicate locations, missing businesses, or outdated operating status can change the result.
For U.S. markets, the Census Bureau’s County Business Patterns can provide a broader independent reference. CBP publishes annual establishment statistics by industry at subnational geographic levels, which can help validate whether the wider supply picture is reasonable.
4. Normalize the Comparison
Raw store counts can be misleading when the markets being compared are different sizes.
A market with 20 restaurants is not necessarily better supplied than one with 10 if the first market has four times as many relevant consumers.
Depending on the category, supply can be normalized against:
- Population
- Households
- Relevant audience
- Consumer spending
- Observed demand
- Another appropriate demand denominator
For U.S. analysis, the American Community Survey provides demographic and household estimates that can support market comparisons when those characteristics are relevant.
The denominator should match the category. Total population may work for some retailers but be a poor proxy for a brand serving a narrow customer segment.
5. Calculate the Apparent Void
A simplified calculation is:
Expected locations = benchmark location density × target-market demand base
Then:
Apparent void = expected locations − existing locations
Consider a hypothetical example:
Benchmark density: 4 locations per 100,000 relevant consumers
Target demand base: 200,000 relevant consumers
Expected supply: 8 locations
Existing supply: 5 locations
Apparent void: 3 locations
The market has roughly three fewer locations than the benchmark would suggest.
It does not mean the market should receive three new stores.
Apparent void ≠ recommended store count.
The result only tells the team that the market deserves deeper investigation.
Five Tests a Retail Void Should Pass Before You Call It an Opportunity
Before treating an apparent gap as an expansion opportunity, test it across five dimensions.
| Test | Question to answer |
| Demand test | Is there enough relevant demand to support another location? |
| Catchment test | Can that demand realistically reach the market or candidate site? |
| Competitive capture test | Is demand already being served outside the analysis boundary? |
| Network test | Would the location create incremental coverage or cannibalize existing stores? |
| Site feasibility test | Are viable locations available at workable economics? |
Competition does not automatically invalidate an opportunity. In some categories, strong competitors confirm that demand exists.
Likewise, an empty market should not automatically pass. The network test should specifically examine whether a proposed location could cannibalize existing stores rather than add meaningful incremental demand.
A stronger definition of opportunity is therefore:
Low relative supply + validated demand + reachable customers + manageable competition + incremental network value + viable sites
That is the difference between identifying a gap and underwriting an opportunity.
Trade Area Design Can Create or Remove a Void
The market boundary deserves as much scrutiny as the final void score.
Suppose one analysis uses a three-mile radius while another uses a fifteen-minute drive time. They may include different populations, competitors, and shopping destinations even when centered on the same location.
Highways, rivers, transit, density, destination behavior, commuting patterns, and willingness to travel for a category can all change the realistic market.
A retail void is only as reliable as the trade area used to calculate it.
This is particularly important when comparing several candidate markets. If each market is defined differently, their void scores may not be directly comparable.
Retail Void Analysis vs Whitespace, Leakage, and Saturation
These analyses are related but answer different questions.
| Analysis | Question it answers |
| Retail void analysis | Which categories or retailers appear underrepresented? |
| Whitespace analysis | Where is a brand or network under-serving potential demand? |
| Retail leakage analysis | Is local spending leaving the market? |
| Saturation analysis | Is the existing supply already sufficient or excessive? |
| Cannibalization analysis | Would a new location redistribute demand from existing stores? |
A void analysis identifies an apparent gap. The other analyses help establish whether that gap represents attractive, reachable, and incremental demand.
Consumers may already travel outside the immediate market for a category. That could indicate unmet local demand, or it could mean a neighboring destination is sufficiently strong that customers are unlikely to switch.
The void alone cannot distinguish between those explanations.
From a Market Gap to a Store Decision
Retail void analysis belongs near the beginning of the site-selection process. A useful decision process moves from screening the market to validating the opportunity and then underwriting the site.
| Stage | What to do | Question to answer |
| 1. Identify the apparent void | Compare existing supply with the benchmark | Where does supply appear lower than expected? |
| 2. Define the realistic trade area | Establish the geography customers can realistically reach | What market are we actually evaluating? |
| 3. Validate demand | Test population, audience, spending, mobility, or other demand signals | Is there enough demand to support additional supply? |
| 4. Test competitive capture | Measure competitors inside and outside the trade area | Is the apparent demand already being served elsewhere? |
| 5. Check network overlap | Compare with existing-store catchments | Would a new location add demand or redistribute it? |
| 6. Confirm site feasibility | Assess sites, access, surrounding retail, and economics | Can the market opportunity translate into a viable location? |
| 7. Forecast performance | Compare candidate sites with relevant performance drivers | What level of performance is realistic? |
| 8. Make the investment decision | Combine opportunity, site economics, and expected performance | Does the location justify the investment? |
Each stage removes a different type of false positive.
Retail void analysis narrows where to look. Demand validation establishes whether the gap is real. Site analysis determines whether the opportunity can actually be captured.
Once candidate sites have been identified, demand forecasting can help estimate expected visits, transactions, revenue, or other performance outcomes before the final investment decision.
Retail void analysis therefore answers:
“Which markets deserve deeper investigation?”
The remaining analysis determines:
“Is there a specific site worth investing in?”
How Factori Supports Retail Void Analysis
Factori connects Places, Mobility, People, and other real-world signals through the Real World Graph so teams can test market gaps against demand, customer movement, competition, trade areas, and network overlap.
Retail teams can use these signals across void analysis, market comparison, site selection, cannibalization analysis, and demand forecasting through Factori’s platform, APIs, and data delivery workflows.
Conclusion
Retail void analysis is valuable because it narrows a large market down to places where supply appears low relative to potential demand.
But absence alone is not an opportunity.
A useful analysis moves beyond asking which retailer or category is missing and tests whether the gap represents enough reachable, incremental demand to support another location.
The objective is not to find the emptiest market. It is to find the gap that can support the next store.
FAQs
What is retail void analysis?
Retail void analysis compares existing retailers or categories within a trade area against a benchmark to identify where supply appears lower than expected. Retailers can use it to screen expansion markets, while property owners can use it to identify potential tenants.
How is a retail void calculated?
A common approach compares normalized store density in a benchmark market with the density in a target market. Expected supply is calculated from the benchmark and compared with the number of existing locations. The resulting gap is an apparent void, not automatically the number of stores the market can support.
What data is needed for retail void analysis?
Typical inputs include POI and business-location data, trade areas, population or audience information, competitor locations, market characteristics, and demand indicators. Mobility and first-party performance data can help validate whether an apparent gap represents genuine opportunity.
Can retail void analysis tell you where to open a store?
Not by itself. Void analysis identifies markets where supply may be lower than expected. Choosing a specific location requires additional analysis of demand, accessibility, competition, catchments, cannibalization, site characteristics, and expected performance.
Does a retail void always mean there is unmet demand?
No. A category can be absent because demand is weak, customers shop elsewhere, suitable sites are unavailable, market economics are unfavorable, or the market is already served from outside the analysis area. A void should be validated before it is treated as an expansion opportunity.