Trade area analysis helps businesses understand where customers come from, how far they travel, and what influences demand around a location.
Older approaches often relied on fixed-radius maps. Modern trade area analysis can also use mobility, drive times, foot traffic, competition, accessibility, weather, and events.
This creates a more realistic view of customer reach for site selection, demand forecasting, marketing, and operational planning.
What Is Trade Area Analysis?
Trade area analysis is the process of identifying the geographic area from which a business attracts customers.
It is also known as catchment area analysis.
The goal is not simply to measure distance around a store. It is to understand where customers actually come from and what affects their willingness to visit.
Trade area data can help answer:
- Where do customers originate?
- How far are they willing to travel?
- Which areas contribute the most visits?
- What barriers affect access?
- Which competitors overlap with the same customers?
Trade area analysis is commonly used in retail, restaurants, healthcare, and commercial real estate.
Why Does Trade Area Analysis Matter?
Location performance depends partly on how much demand a business can realistically reach.
If the trade area is estimated incorrectly, businesses may overestimate demand or misunderstand the true market.
This can lead to:
- Weak footfall
- Poor inventory allocation
- Inefficient marketing
- Overestimated sales
- Lower site profitability
Accurate trade area analysis can support:
- Site selection
- Expansion planning
- Market analysis
- Local marketing
- Demand forecasting
- Network planning
Trade areas are especially useful when comparing locations that look similar based on demographics but behave differently in the real world.
What Are the Main Types of Trade Areas?
Trade areas are often divided into three levels.
Primary Trade Area
The primary trade area contains the strongest concentration of customers.
These customers usually contribute the highest share of visits or demand.
Secondary Trade Area
The secondary trade area includes customers who travel farther and contribute a smaller share of demand.
Tertiary Trade Area
The tertiary trade area includes occasional or long-distance visitors.
These customers usually contribute less frequently.
The size and shape of each area depend on factors such as:
- Brand strength
- Accessibility
- Competition
- Customer preferences
- Transport infrastructure
A destination retailer may therefore have a much larger trade area than a convenience-led business.
What Are the Main Trade Area Analysis Methods?
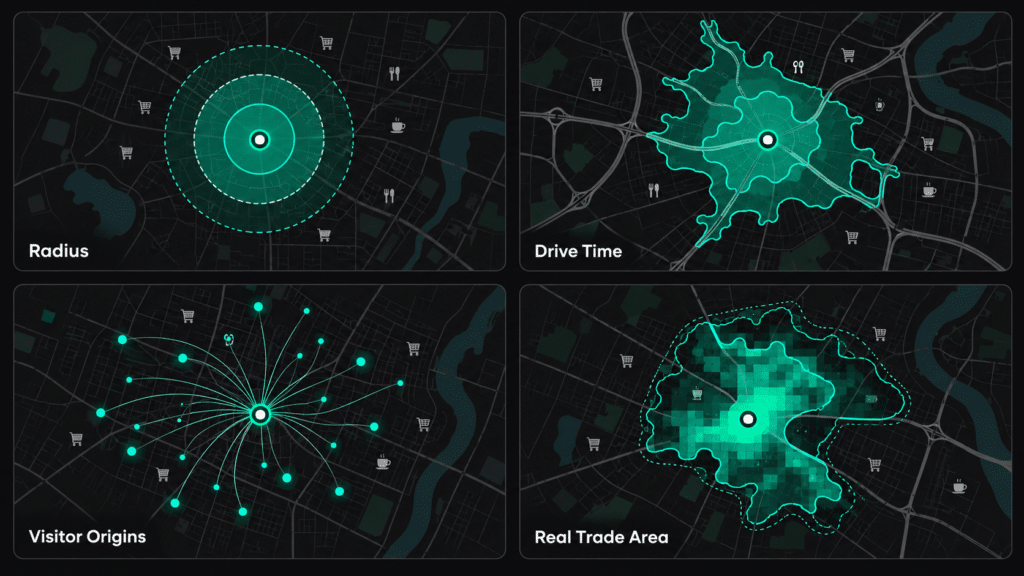
Different trade area analysis methods answer different questions.
1. Radius-Based Analysis
Radius analysis draws a fixed boundary around a location, such as three miles or five kilometers.
It is simple and useful for an initial market view.
But it assumes customers travel equally in every direction.
It may ignore:
- Traffic
- Road networks
- Rivers and highways
- Public transport
- Competitors
For this reason, radius-based analysis can oversimplify actual customer behavior.
2. Drive-Time or Isochrone Analysis
Drive-time analysis measures the area customers can reach within a defined travel time.
For example, a retailer may compare 10-minute and 20-minute drive-time areas.
This method considers road networks and accessibility more directly than a simple radius.
The U.S. Census Bureau also publishes information on where people work, how they commute, when they leave home, and how long journeys take. This can provide additional context when studying accessibility and movement. Explore U.S. Census commuting data.
3. Customer-Derived Trade Areas
Customer-derived trade areas use actual customer-origin information.
Inputs can include:
- Loyalty records
- Transaction data
- Mobility data
- Foot traffic data
This method can show where real customers come from instead of assuming where they should come from.
Esri’s current trade-area tools also support customer-derived areas based on customer counts or customer volume. See Esri’s trade area methods.
4. Gravity Models
Gravity models estimate the likelihood that customers will visit a location.
They can consider factors such as:
- Distance
- Site attractiveness
- Competition
- Accessibility
These methods are useful when businesses want to model potential customer behavior before a location opens.
No single method works for every business.
Modern trade area analysis often combines multiple methods.
What Data Is Used in Trade Area Analysis?
Strong trade area analysis depends on multiple data layers.
| Data Layer | What It Helps Explain |
|---|---|
| Demographics | Who lives around the location |
| Mobility data | Where visitors come from and how they move |
| Foot traffic | Visit frequency and activity patterns |
| Accessibility | Drive times, roads, traffic, and transit |
| POI data | Nearby businesses and demand generators |
| Competition | Market saturation and overlapping catchments |
| Events and weather | Short-term changes in movement and demand |
Trade area data becomes more valuable when these layers can be analyzed together.
How to Conduct Trade Area Analysis
A structured process makes the analysis easier to repeat across locations.
Step 1: Collect Customer and Location Data
Start with customer origins, demographics, mobility patterns, and store performance.
Step 2: Map Customer Concentration
Identify where customer visits or demand are concentrated.
This shows which areas contribute most strongly to the location.
Step 3: Analyze Accessibility
Review:
- Drive times
- Road access
- Traffic
- Public transport
Distance alone does not always explain customer reach.
Step 4: Assess Competition
Identify competitors and overlapping customer catchments.
Competition may change how far customers are willing to travel.
Step 5: Define Trade Area Boundaries
Divide the market into primary, secondary, and tertiary areas based on customer contribution.
Step 6: Validate Against Real Demand
Compare the proposed trade area with actual visits, movement patterns, and customer origins.
Step 7: Refine Forecasts
Use the results to improve:
- Revenue forecasts
- Site decisions
- Local operations
- Expansion planning
Trade Area Analysis for Site Selection
Trade area analysis for site selection helps businesses understand the realistic demand available to a candidate location.
Two sites can have similar population and income levels but very different customer reach.
One may have:
- Better road access
- Stronger surrounding businesses
- More visitor activity
- Lower competition
- A larger customer catchment
The other may sit close to a large population but face poor accessibility or strong competitive pressure.
Trade area analysis therefore adds another layer to site selection beyond demographics.
Trade Area Analysis Example: QSR Location
Trade area analysis for QSR businesses is particularly important because convenience, accessibility, competition, and travel behavior can strongly affect restaurant visits.
Consider two suburban QSR candidate sites.
Both may have similar household counts.
But Site A may sit near a busy commuter route with easy vehicle access, while Site B may have more competing restaurants within the same catchment.
A QSR trade area analysis could compare:
| Factor | Site A | Site B |
|---|---|---|
| Customer reach | Strong drive-time access | Similar population nearby |
| Mobility | High commuter flow | Lower passing activity |
| Competition | Lower category density | More nearby QSR competitors |
| Accessibility | Easy road access | Less convenient access |
The objective is not to choose based on one metric.
It is to understand how customer reach, accessibility, and competition work together.
Esri provides a current example of QSR market analysis using nearby restaurant counts, competitor density, and distance from candidate sites. See the QSR analysis example.
Trade Area Analysis vs. Market Area Analysis
Trade area analysis and market area analysis are related, but they answer slightly different questions.
Trade area analysis focuses on the geographic areas that actually or potentially contribute customers to a specific location.
Market area analysis is broader. It examines the overall market in which a business operates, including demand, population, competition, and growth potential.
A business may first use market area analysis to identify an attractive city or region.
It can then use trade area analysis to compare specific locations within that market.
How Real-World Data Improves Trade Area Analysis
Traditional models often rely on demographics and distance.
Real-world data adds information about how customers actually behave.
Mobility and Foot Traffic
Mobility data can show:
- Visitor origins
- Visit frequency
- Dwell time
- Movement patterns
This helps businesses build catchments around observed behavior.
Accessibility
Drive times, road networks, traffic, and transit can explain why two nearby areas generate different customer activity.
Competition
POI and competitor data show where similar businesses operate and where trade areas may overlap.
Dynamic External Signals
Weather, events, seasonality, and traffic disruptions can change movement patterns.
These signals can help explain short-term changes in demand.
How Trade Area Analysis Improves Forecasting
Better trade area visibility can improve several business decisions.
Better Demand Estimation
Observed movement can provide a more realistic view of customer reach than fixed-radius assumptions.
Better Footfall Forecasting
Movement patterns can help explain when customer activity is likely to increase or decrease.
Better Revenue Forecasting
More realistic customer reach can reduce uncertainty in site-level demand forecasts.
Better Operational Planning
Trade area insights can support:
- Inventory planning
- Staffing
- Local marketing
- Regional demand allocation
Common Trade Area Analysis Mistakes
Several mistakes can weaken the analysis.
Using Only Fixed-Radius Areas
Customers do not travel equally in every direction.
Ignoring Accessibility
Roads, congestion, transit, and barriers can change customer behavior.
Using Outdated Data
Population, businesses, movement, and competition change over time.
Ignoring Competition
A large customer base may still be shared across several competing locations.
Treating Trade Areas as Permanent
Trade areas can change as infrastructure, customer behavior, competitors, and surrounding markets evolve.
Businesses should review them regularly.
How Factori Supports Trade Area Analysis
Factori provides real-world data that can support trade area and catchment analysis.
Mobility data helps teams understand visitor origins and movement patterns.
Places data provides context about competitors, surrounding businesses, and demand generators.
People and audience data add customer and demographic context.
Combined, these signals can support:
- Trade area analysis
- Site selection
- Market area analysis
- Demand forecasting
- Network planning
- Local marketing
Teams can use these datasets to move beyond simple radius-based assumptions and build a clearer view of real-world customer reach.
Conclusion
Trade area analysis has moved beyond simple radius mapping.
Modern analysis can combine mobility, accessibility, customer origins, competition, demographics, and external signals to understand how customers actually interact with locations.
This improves site selection, forecasting, marketing, and operations.
The goal is not to draw a larger or more complex map.
It is to define a customer catchment that reflects how demand behaves in the real world.
FAQs
What Is Trade Area Analysis?
Trade area analysis identifies the geographic area from which a business attracts customers.
It helps businesses understand customer reach, demand concentration, accessibility, and market penetration.
What Is the Difference Between Trade Area and Market Area Analysis?
Trade area analysis focuses on the customer catchment around a specific location.
Market area analysis is broader and evaluates overall demand, competition, and market potential across a larger geography.
What Are the Main Trade Area Analysis Methods?
Common trade area analysis methods include radius analysis, drive-time analysis, customer-derived trade areas, and gravity models.
What Data Is Needed for Trade Area Analysis?
Useful trade area data includes demographics, mobility, foot traffic, customer origins, accessibility, POIs, competition, weather, and local events.
How Is Trade Area Analysis Used for Site Selection?
Trade area analysis for site selection helps businesses estimate customer reach, compare accessibility, evaluate competition, and understand whether enough demand exists around a candidate site.