Local-level indicators of income, employment, daytime population, and more. So your plans reflect what's actually happening in a market, not just historical performance. Built for teams making decisions around expansion, investment, pricing and demand.
Trusted by

Trusted by
Local employment and unemployment levels that affect confidence, spend, and risk.

How affluent an area is, with easy‑to‑read indicators of income and overall prosperity.

Where people are during the day versus where they live—crucial for stores, branches, and depots.

High‑level trends in who lives in an area and whether it’s growing, stable, or shrinking.

Simple measures of economic stress or resilience by neighborhood or trade area.

All values are aggregated by area and sourced from official public statistics and trusted partners—no individual‑level data.
Tie your forecasts, budgets, and growth plans to local economic conditions, not just last year’s numbers.
Quickly see whether economic differences are part of the story when two sites perform differently.
Know which areas are strengthening or softening before you commit capital or campaigns.
Give finance, strategy, forecasting, and operations a shared, objective picture of the economic backdrop.
Economic data helps any demand forecaster explain why numbers shifted, whether it's an employment drop, income pressure or population change driving the variance, making forecasting & demand planning more grounded than models built on internal data alone.

Retail demand forecasting improves significantly when you factor in local economic indicators. Spending power and employment levels in a trade area reveal far more about long-term potential than last year’s sales alone.

Adjust mix, pack, and price strategies to the economic realities of different regions and banners.
Demand planning and forecasting at the category level needs local economic context, what sells in an affluent suburban area won't mirror what moves in a market under economic stress

AI demand forecasting models and risk scoring tools both get sharper when grounded in real local conditions - income levels, unemployment trends and economic stress signals that internal data rarely captures on its own.

Score locations and neighborhoods by economic potential and stability when underwriting or expanding.
Supply chain forecasting and network investment decisions benefit from the same local economic pulse, understanding whether a market is growing, stable, or softening before you commit.

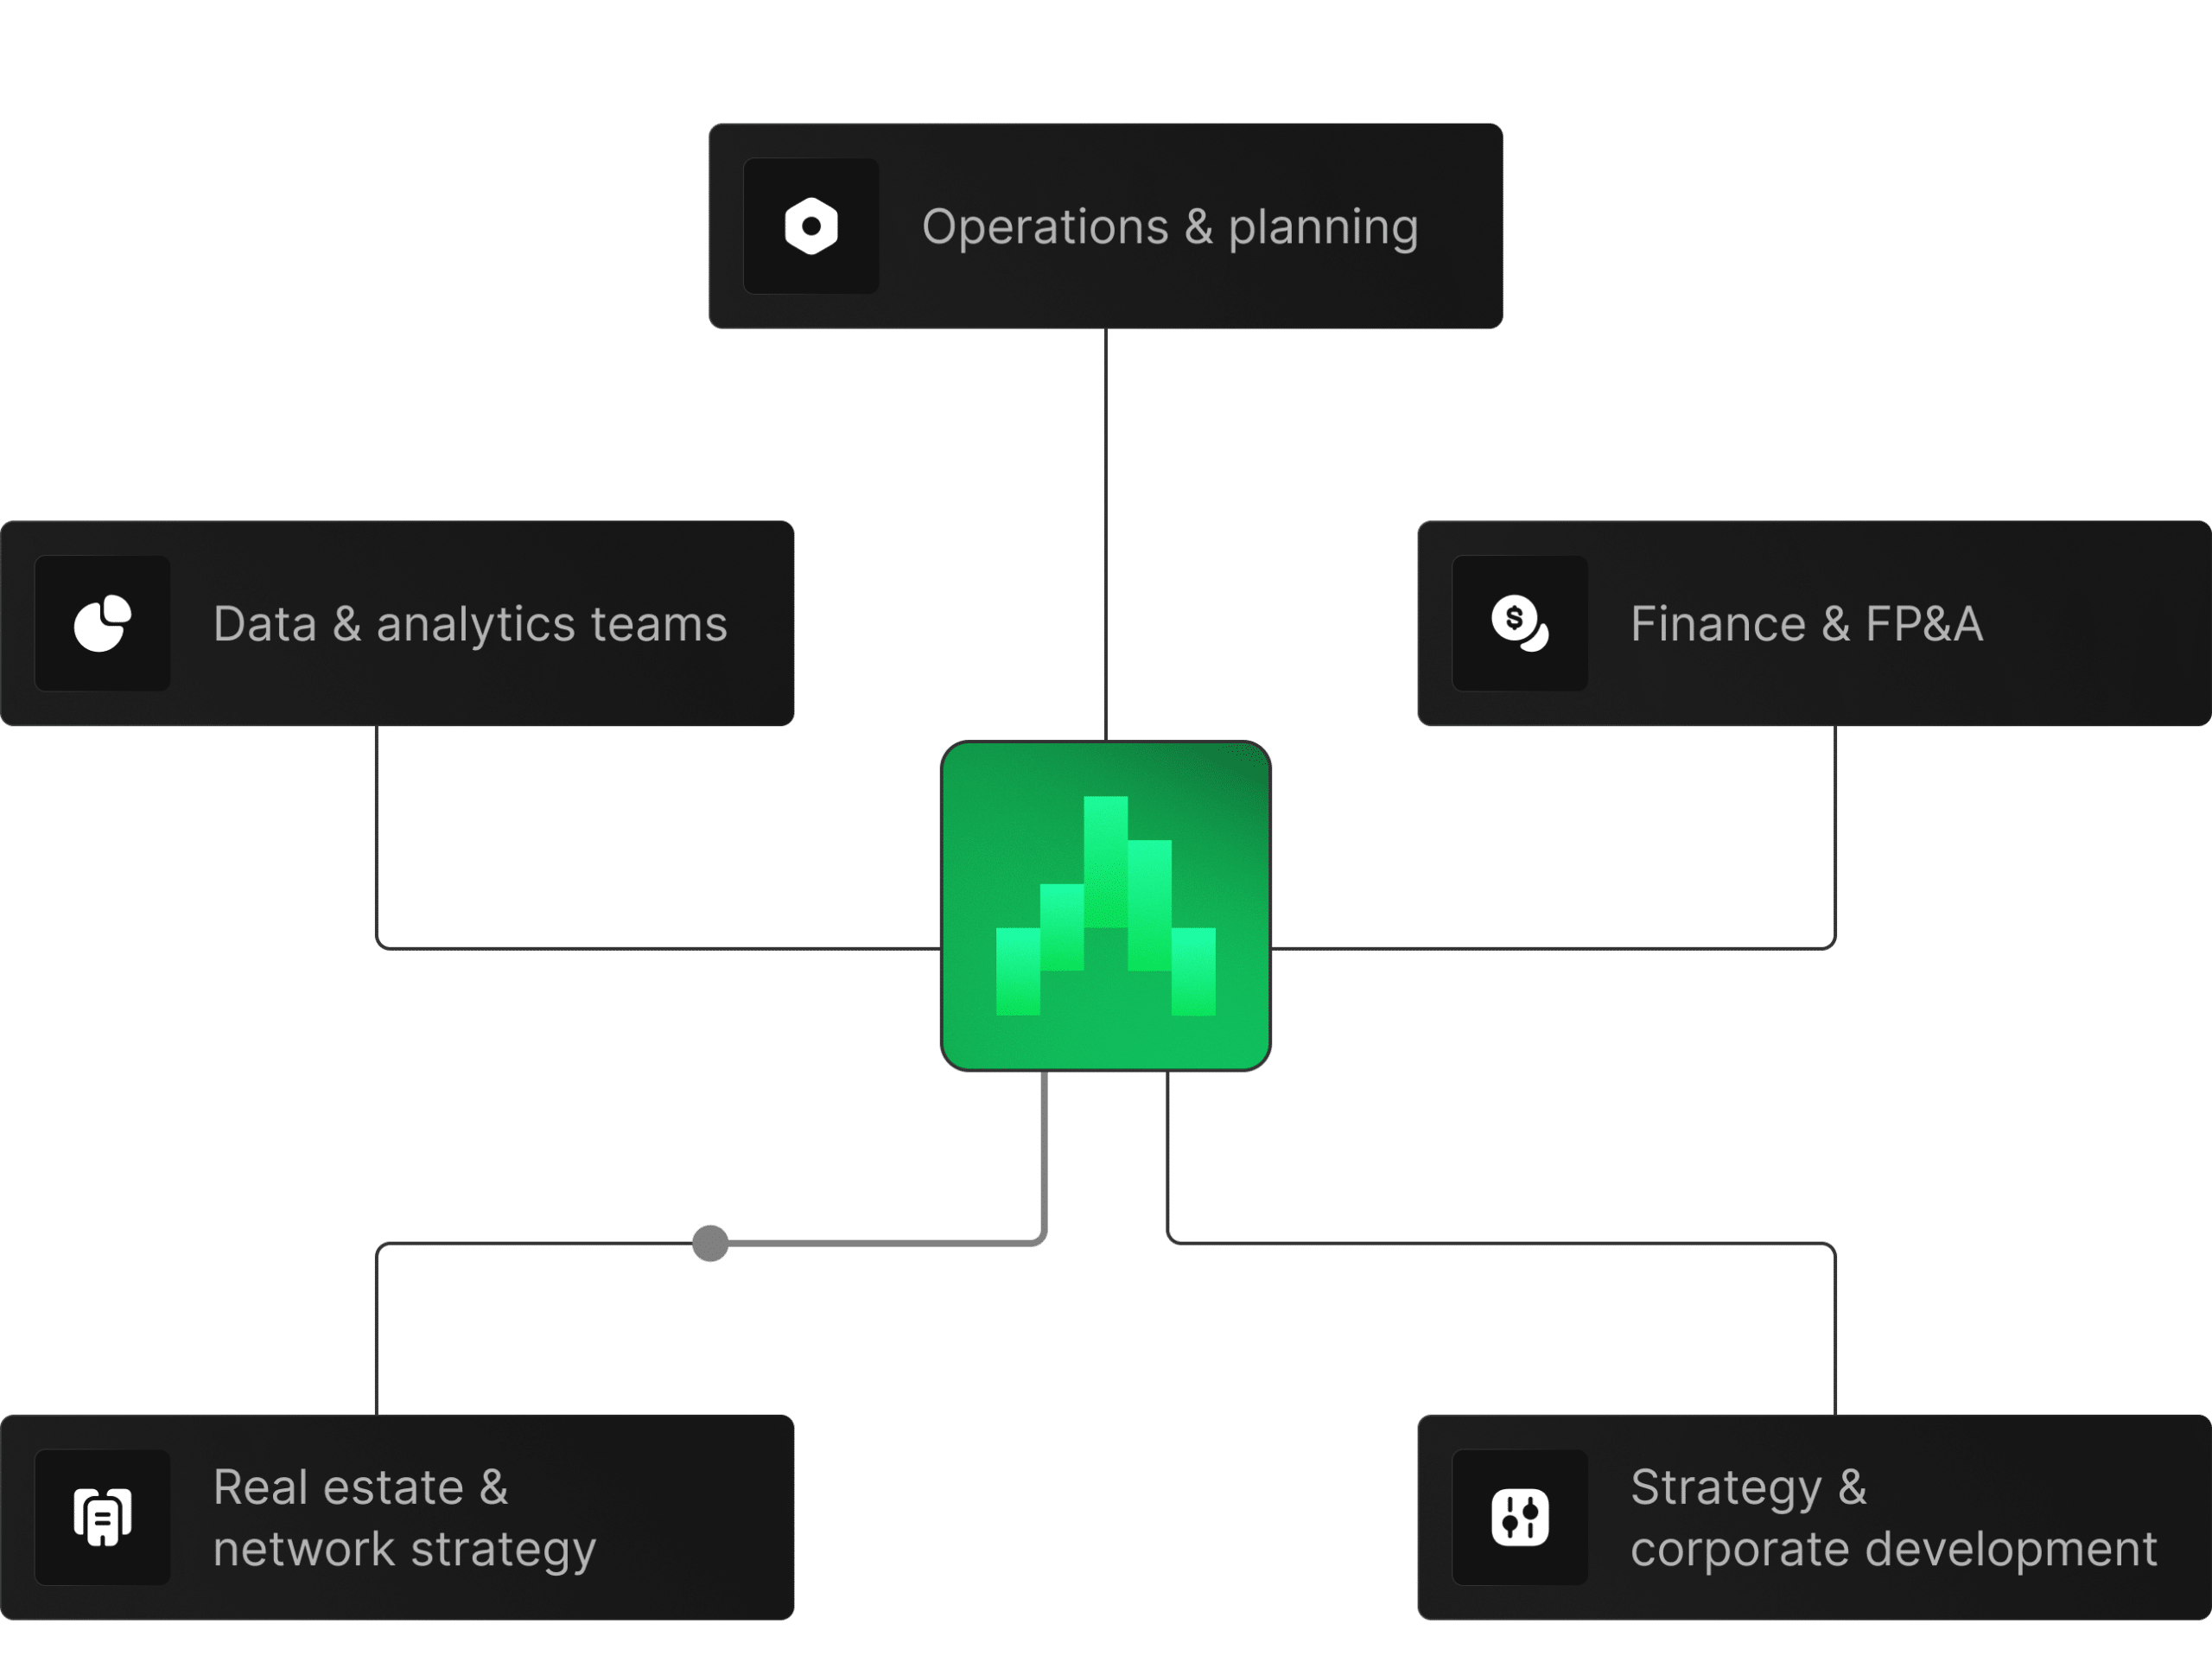
 Finance & FP&A
Stress‑testing plans, budgets, and scenarios.
 Strategy & corporate development
Choosing where to invest, grow, or pull back.
 Data & analytics teams
Adding clean, interpretable economic context to models and dashboards.
 Real estate & network strategy
Evaluating sites and markets with an economic lens, not just traffic and rent.
 Operations & planning
Understanding which markets may need different staffing, inventory, or service levels.


Tell us which regions, cities, or trade areas matter most.
Explore how Economic looks for a handful of key locations and how it lines up with what you’re seeing.
Connect Economic data to your forecasting, finance, strategy, and planning workflows.
Factori Economic Data turns local economic conditions into ready-to-join indicators for forecasting, market planning, finance, risk analysis, site selection, and investment decisions.
Businesses use Economic Data for demand forecasting, market planning, branch strategy, site selection, risk modeling, portfolio analysis, expansion planning, and economic resilience analysis across markets and trade areas.
Economic Data helps models and planning teams account for income, employment, unemployment, population growth, daytime population, prosperity, and economic stress across markets and trade areas.
Factori builds Economic Data from public statistical sources, government datasets, labor market data, census-style sources, economic indicators, commercial sources, and geographic enrichment layers. These are normalized by location, time, and market.
Customers can access using any of these options:
(1) Download a 100-row sample CSV for FREE
(2) Connect the MCP server to your AI client and query in natural language
(3) Book a 30-minute discovery call, validate fit against a specific use case.
(4) Factori Platform
Economic Data refresh frequency depends on the source and indicator. Some labor and market indicators may update monthly or quarterly, while census-style and structural indicators may update annually or on official release cycles.
Economic Data helps explain local demand conditions that internal data alone cannot capture. Income, employment, population growth, and economic stress can affect sales, footfall, credit demand, insurance risk, branch performance, and market resilience.
© 2026 Factori. All rights reserved.


