Factori helps you see the full picture around every potential site—who’s there, what’s nearby, how people move, and how the local market is performing—so you can make fewer risky bets and more confident “yes” decisions.
Trusted by

Trusted by
Most site decisions still rely on a mix of internal reports, one‑off studies, and gut feel.
Factori gives you a consistent external view for every site you evaluate:
For QSR brands, retail site selection goes beyond finding a busy corner. Combining mobility, foot traffic, local demographics, and competitive density helps identify drive-thru and walk-up locations that genuinely match your format and your customer.
Not every busy trade area can support a new store. Retail site selection for grocery and general retail uses spend patterns, demographics, and local sales data to confirm whether a market is actually ready for you.
Retail store location and site selection for convenience and fuel sites needs ground-level signals, traffic flow, nearby formats and local demand to make the call with confidence.

Getting into the right markets matters more than getting into more markets. Retail site selection analysis helps CPG and wholesale teams prioritize banners and locations based on category spend and neighborhood fit.

Real-world retail site selection data on foot traffic, tenant mix and neighborhood trends gives landlords the evidence to attract the right tenants and close faster.

Is this location in a high‑traffic, high‑fit area or just a busy corner?
Who actually lives, works, and shops in the trade area?
Are we cannibalizing an existing site or tapping into new demand?
Is the market growing, stable, or softening?
Are we surrounded by the right mix of businesses, anchors, and formats?
You don’t need another abstract score. You need simple, concrete signals you can put in front of your committee.
You choose the mix; we make them easy to line up side‑by‑side for every option.


How people move through the physical world—visits and patterns around stores, venues, and neighborhoods.


Clean, consistent details about stores, restaurants, venues, points of interest, and their surroundings.


Business density and composition by area: categories, formats, and competitive mix around your locations.


Privacy‑safe consumer graph covering demographics, income bands, lifestyle and interest indicators.


Retail sales indicators by market and category to show where spend is rising or softening.


Context on parcels and neighborhoods: land use, property types, and housing stress indicators.
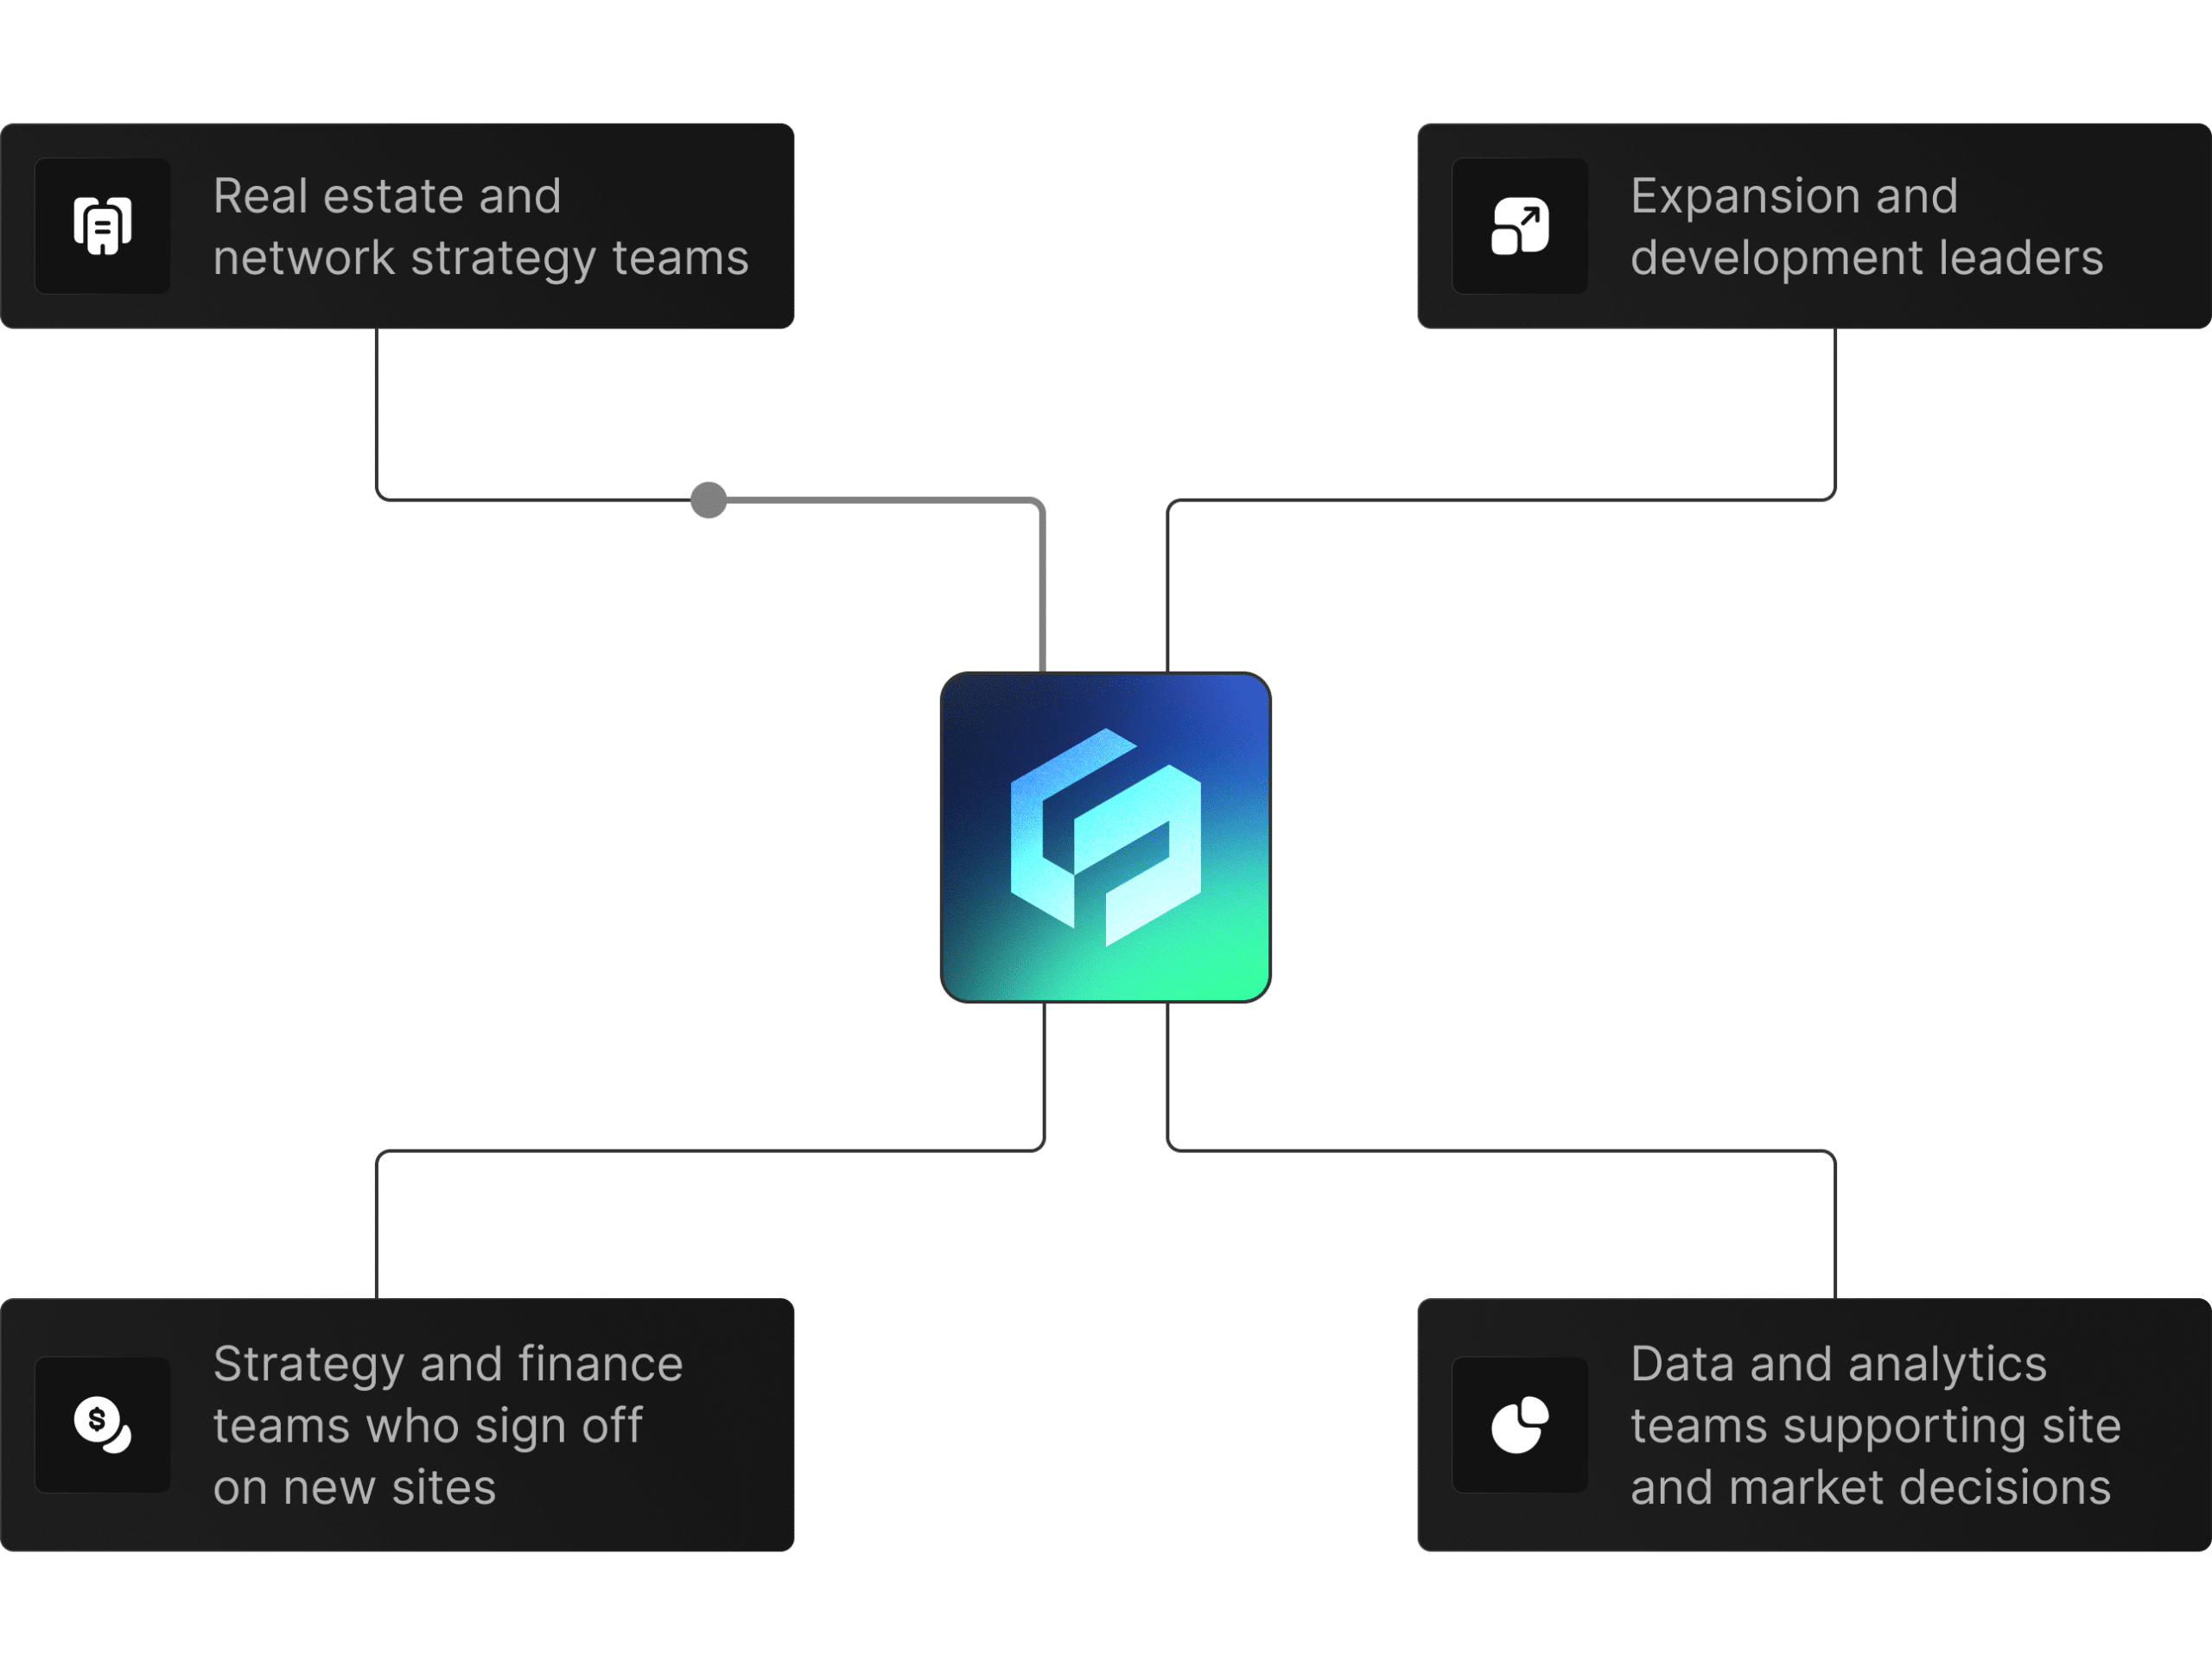
 Real estate and network strategy teams
 Expansion and development leaders
 Strategy and finance teams who sign off on new sites
 Data and analytics teams supporting site and market decisions
A mix of recent opens, stable performers, and candidates you’re considering.
Mobility, Places, Business, People, Economic, and anything else that’s relevant for your format.
See which patterns show up repeatedly—and which sites don’t look so strong under the same lens.
Align on a short list of signals that must be checked for every new site decision going forward.
Retail site selection is the process of choosing the best store, branch, restaurant, or service location using market demand, trade area quality, competitor density, foot traffic, audience fit, property context, and local economic signals.
Factori helps teams compare candidate sites using mobility, places, people, property, business, retail sales, economic, and geo data. This gives expansion teams a deeper view of footfall, competition, catchments, audience fit, nearby anchors, and demand potential.
Factori gives site selection teams explainable external signals instead of relying only on broker decks, intuition, or static demographic reports. It helps real estate, strategy, and analytics teams make faster, more evidence-based location decisions.
Retailers can use Factori to compare successful stores, underperforming stores, recent openings, and new candidate sites. This helps identify patterns linked to strong performance, weak trade areas, cannibalization risk, competitor pressure, and market saturation before capital is committed.
© 2026 Factori. All rights reserved.


