Talk to the real world with Factori MCP - Get Started Now
Talk to the real world with Factori MCP - Get Started Now
Factori helps governments and public agencies see what’s actually happening on the ground—how people move, who lives where, what’s around key sites, and how neighborhoods are changing—so you can design better policies, services, and operations.
Trusted by





Trusted by
Most public sector decisions still lean on:
That makes it hard to see:
Factori adds a simple, outside‑in layer to your existing data, so you can:
Understand who lives, works, and moves through each area before changing zoning, services, or amenities.

Decide where to place clinics, community centers, hubs, and offices based on need and access.

Align projects with real movement, traffic patterns, and demand, not just theory.

See how economic stress, traffic, and events shape where support or enforcement is most needed.

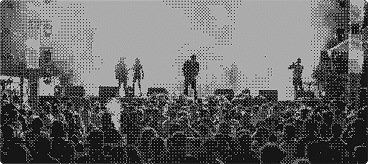
Plan around concerts, sports, festivals, and civic events with better crowd and traffic context.
Target investment and support to neighborhoods and corridors where the conditions for growth are strongest.

You bring administrative, program, and operational data. Factori brings the real‑world layer.
All datasets are aggregated and designed to be simple to understand, share, and join to your geographies and assets.



Aggregated neighborhood profiles (privacy‑safe): age mix, income bands, household types, lifestyle indicators.




Which corridors truly carry the most people, and when?
Where are services hardest to reach for lower‑income or aging populations?
Which main streets are quietly strengthening vs. at risk of decline?
How will a new stadium, campus, or district affect nearby neighborhoods and traffic?
Where should we focus limited resources for safety, resilience, or economic support?
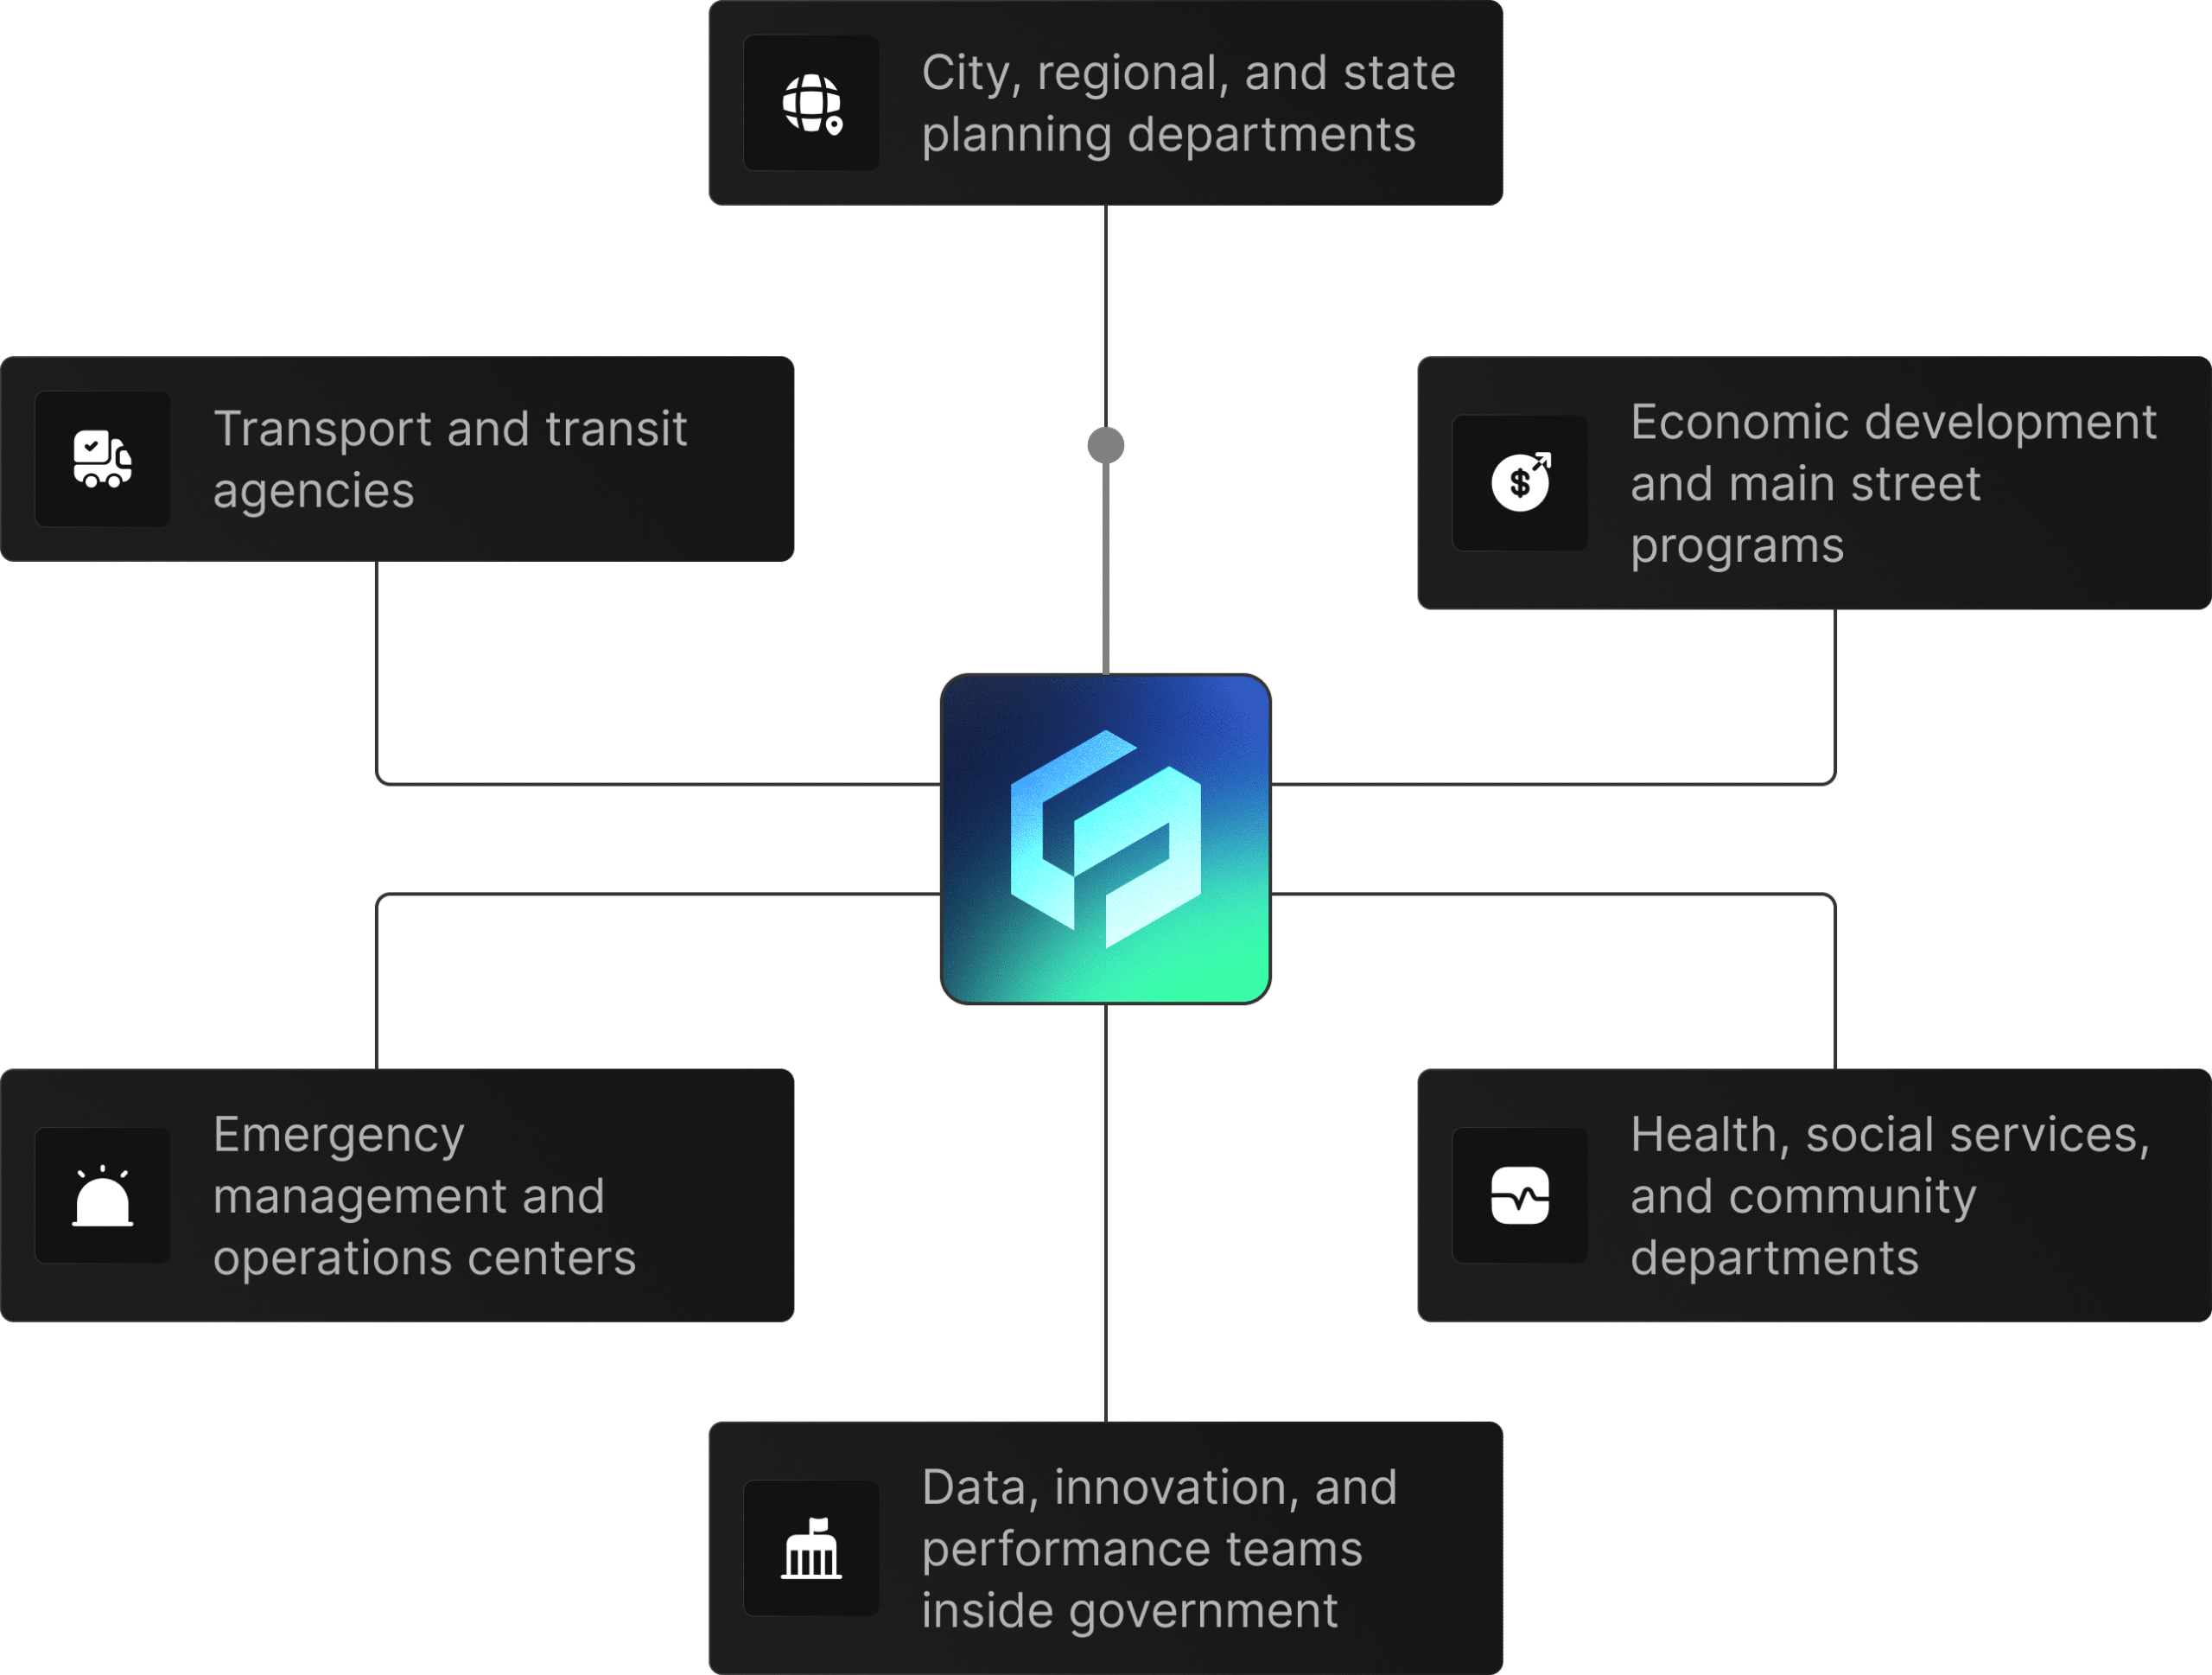
 City, regional, and state planning departments
 Transport and transit agencies
 Economic development and main street programs
 Emergency management and operations centers
 Health, social services, and community departments
 Data, innovation, and performance teams inside government
For example: a planned corridor project, an upcoming season of events, or a service placement question.

Common starting point for public sector: Mobility + People + Economic + Places + Traffic, then add Events, Business, Retail Sales, or Property as needed.
Compare how you plan today vs. how decisions look with real‑world data, and decide where to adjust plans, investments, or operations first.
Factori helps public sector teams improve urban planning, transportation planning, economic development, infrastructure strategy, emergency readiness, tourism analysis, service delivery, and resource allocation using real-world external data.
Public sector teams use Factori for mobility planning, corridor analysis, economic development, downtown recovery tracking, business district analysis, public facility planning, event readiness, resource allocation, and community needs assessment.
Factori helps agencies make faster, more evidence-based decisions, improve service delivery, identify underserved areas, understand movement patterns, support economic development, and allocate resources based on current local conditions.
Factori data can be delivered via CSV, APIs, platform workflows, or MCP-enabled access. It can integrate with GIS systems, public dashboards, planning tools, BI platforms, data portals, transportation models, and policy analytics workflows.
Factori provides aggregated, privacy-safe, policy-aligned data for public planning. Data is normalized, geospatially validated, and designed to support responsible analytics without exposing individual-level movement or identity.
Products
Solutions By Use Case
By Use Case
By Industry
© 2026 Factori. All rights reserved.