Talk to the real world with Factori MCP - Get Started Now
Talk to the real world with Factori MCP - Get Started Now
Factori helps you use real‑world signals—footfall, events, local economics, traffic, and more—to build schedules and staffing plans that match what’s actually happening around every store, branch, hotel, depot, or service area.
Trusted by





Trusted by
Most schedules are built from history and simple rules of thumb. That breaks when:
Factori adds the outside‑in view you’re missing, so you can:
One of the most practical workforce optimization strategies is aligning shifts to what's actually happening at each location.
Real footfall patterns, visit trends and local activity help teams move beyond last year's averages and build schedules that reflect true demand.

Events, local foot traffic, and area activity give teams the context to plan front-of-house, back-of-house and housekeeping schedules that actually hold up on busy days.
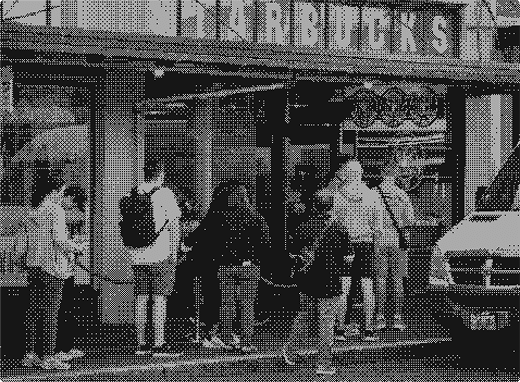
Workforce optimization in logistics means matching labor to volume, not just the calendar.
Mobility signals, retail trends, and demand patterns help depot and warehouse teams build shift plans that reflect real inbound and outbound flow, not just historical averages

Adding external signals like local events, weather shifts and area activity helps teams anticipate spikes earlier, so cover is in place before the queue builds.

Good workforce optimization solutions for field teams go beyond route efficiency.
Traffic patterns, local demand data and area activity help planners schedule visits and routes around what's actually happening on the ground, not just what worked last quarter.

You keep your current WFM tools and forecasts. Factori feeds them better context.
You choose which signals matter most for your business. We make them simple and comparable across locations.



How people move through the physical world—visits and patterns around stores, venues, and neighborhoods.


Clean, consistent details about stores, restaurants, venues, points of interest, and their surroundings.


Privacy‑safe consumer graph covering demographics, income bands, lifestyle and interest indicators.


Local events that move demand: concerts, sports, conferences, school calendars, public holidays, and more.


Search and commerce signals: which brands, products, and categories are gaining attention across markets.
Use Mobility, Events, and Retail Sales to reshape daily and weekly staffing curves by store, branch, or site.
Stop using a one‑size‑fits‑all rule. Group locations by neighborhood, economic strength, and visit patterns.
Combine Events and Market data to anticipate abnormal days—concert nights, big games, holiday runs, weather‑sensitive periods.
Use People, Economic, and Mobility data to set initial staffing levels where you don’t yet have history.
When labor runs high or low vs plan, quickly see if traffic, events, or local conditions were part of the story.
Which branches are consistently understaffed at peak hours?
Where can we reduce overtime without hurting service levels?
How should staffing look in new locations with similar external profiles?
How should we adjust staffing at these stores on event days vs normal days?
Which depots will feel the impact first if local demand or economics change?
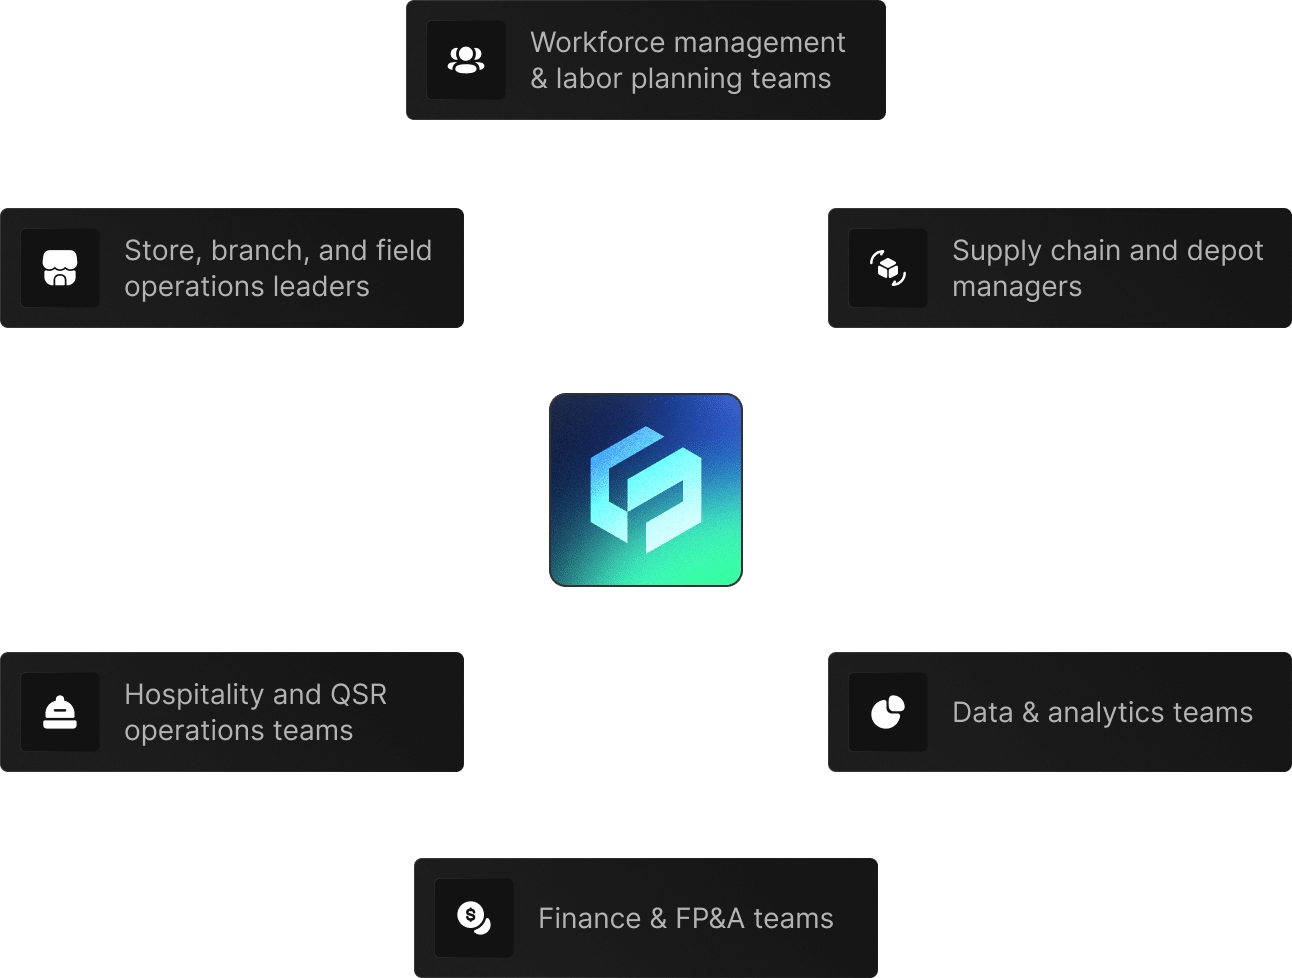
 Workforce management and labor planning teams
=
 Store, branch, and field operations leaders
=
 Supply chain and depot managers
 Hospitality and QSR operations teams
 Data & analytics teams supporting forecasting and planning
 Finance & FP&A teams tracking labor costs and service levels
Choose 50–200 locations (stores, branches, hotels, depots) where staffing is a known pain point.

For example: Mobility + Events + Traffic for QSR and retail, or People + Economic + Retail Sales for branches and service sites.
Use Factori data to propose adjusted curves and coverage, then compare impact on service, sales, and labor variance.
Workforce optimization is the process of aligning staffing, labor hours, schedules, and service capacity with expected customer demand across locations, dayparts, weekdays, seasons, and market conditions.
Factori helps workforce teams predict labor needs using real-world signals such as mobility, footfall, events, weather, local activity, economic conditions, and demand trends. These signals help teams plan staffing more accurately by store, branch, region, and daypart.
Factori gives operations and workforce planning teams external demand context that internal schedules or historical sales may miss. It helps explain why certain locations need more or fewer labor hours based on real-world conditions.
Businesses can enrich labor forecasts with Factori signals to better anticipate traffic spikes, slow periods, event-driven demand, weather disruption, and local market changes. This helps improve service levels, labor productivity, employee utilization, and cost control.
Products
Solutions By Use Case
By Use Case
By Industry
© 2026 Factori. All rights reserved.