Talk to the real world with Factori MCP - Get Started Now
Talk to the real world with Factori MCP - Get Started Now
The Aggregated Spend dataset gives you indexed consumer spend and demand signals per hex cell, spend index, category penetration, brand affinity and purchase frequency. Use it to see where spend is growing, which categories are winning, and how your key markets are really behaving.
Trusted by





Trusted by
How far consumer spend in a category sits above or below the national average and how that spend is distributed across brands.
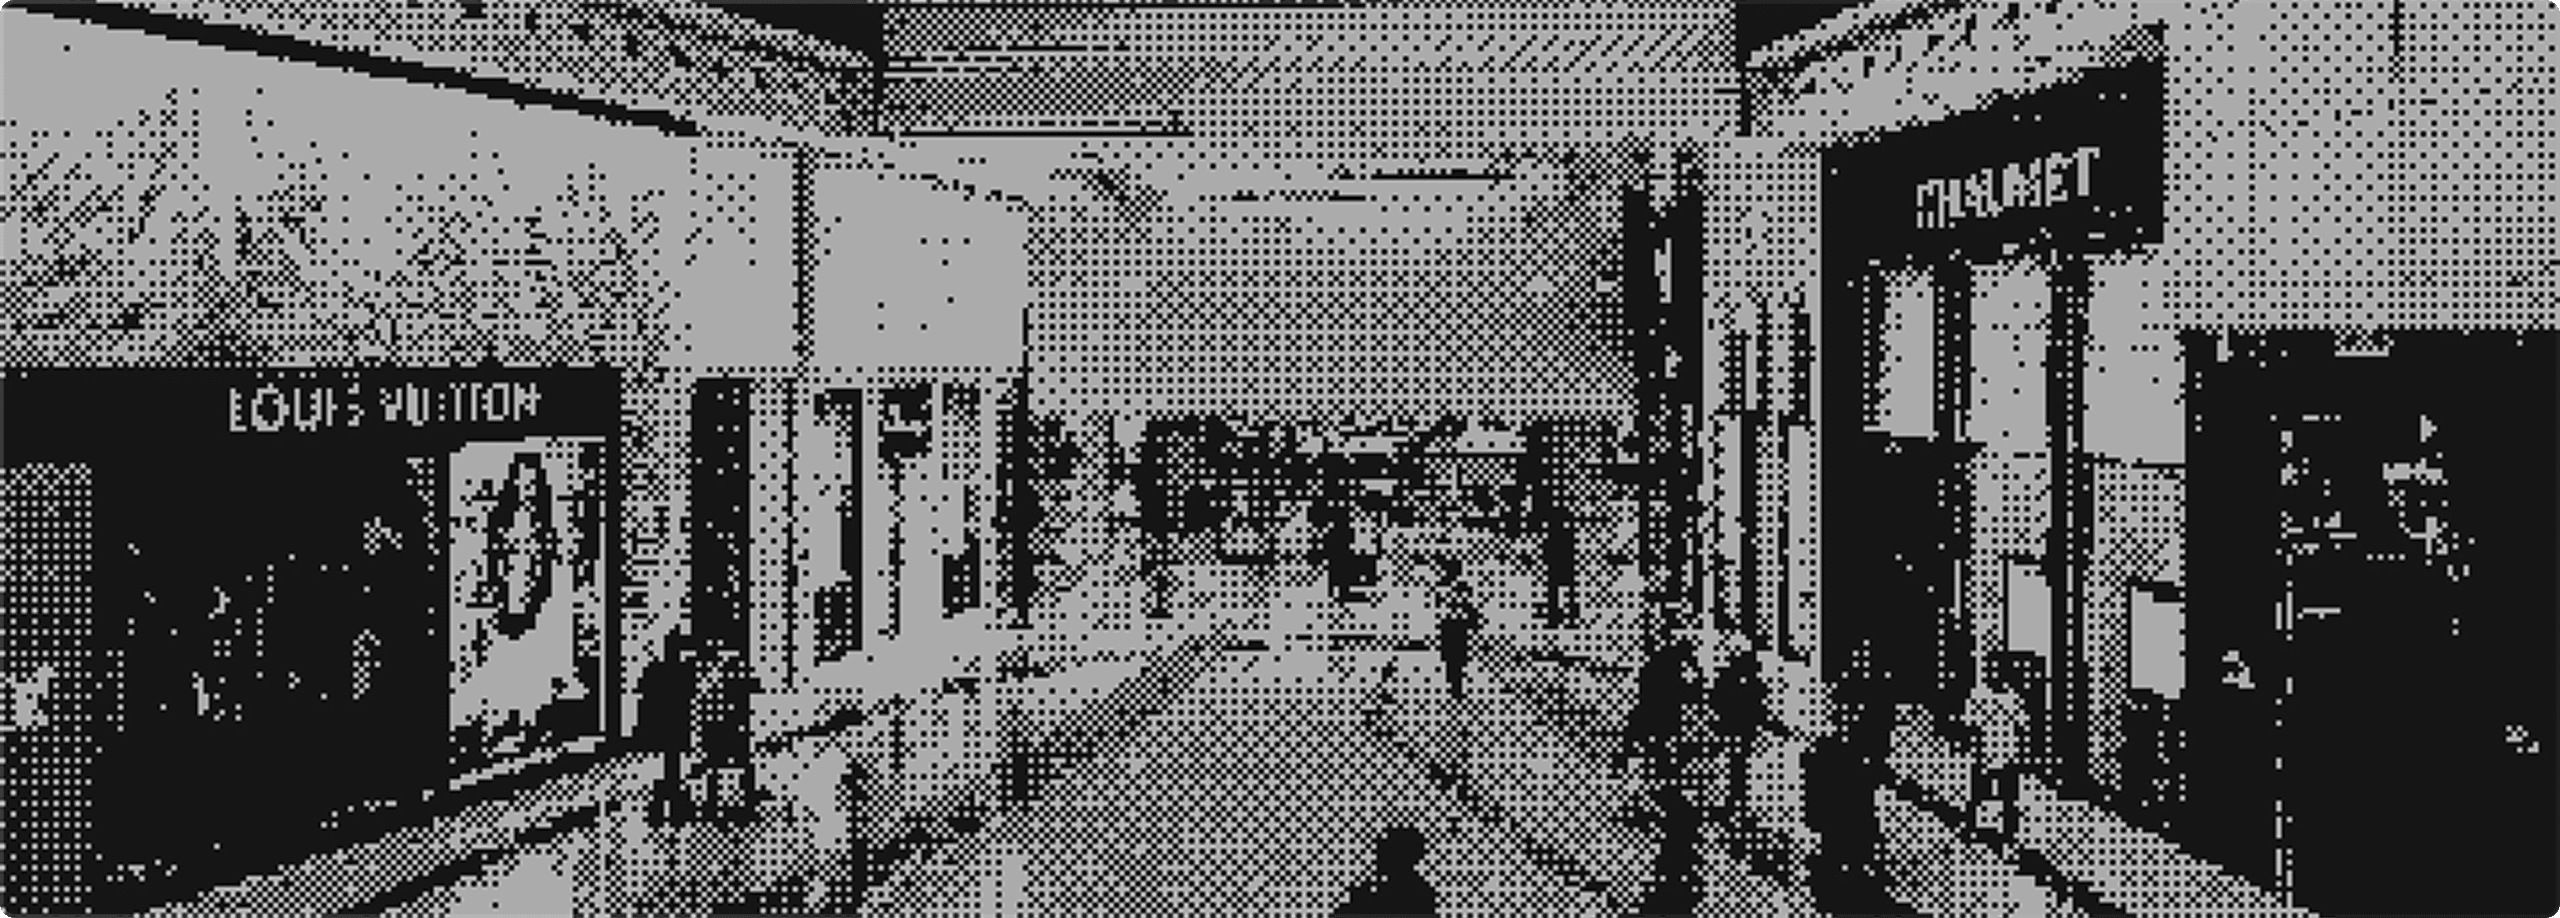
Which brands shoppers gravitate toward in a given area, observed behavior, not modeled guesswork.

How deeply a category or brand has taken hold in a given market, hex by hex.

The split between digital and in-store spend and how often shoppers return to a category by market, down to H3 resolutions r6–r9.

Understand total category behavior, not just your own sales, so you can size the true opportunity.
Identify where categories are heating up or cooling down before it shows up in lagging internal reports.
Compare your trends against the broader market to see if a problem is local, category‑wide, or competitor‑specific.
Give demand planning, marketing, and finance a shared view of where spend is actually moving, grounded in observed behavior, not survey panels.
Feed market-level spend index, category penetration, and brand affinity into demand models as an external signal, so forecasts can explain shifts that internal sales data alone would only show after the fact.

Allocate shelf space and merchandising emphasis to categories and brands with rising spend index and penetration in a given market.

See how competitor spend is trending and where promotions are actually moving the spend index, not just driving short-term volume.
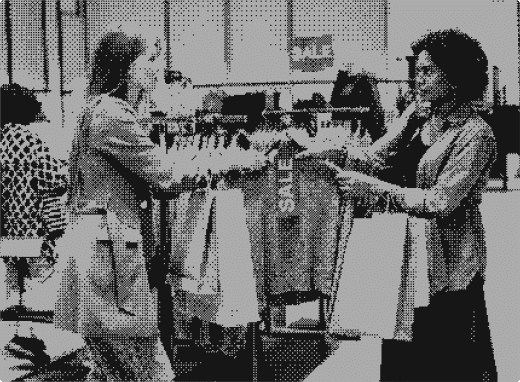
Pick markets for new stores, campaigns, or investment based on observed spend concentration, not guesswork.

Use spend-based outcomes not just impressions or clicks to evaluate campaigns and inform next-cycle media planning.
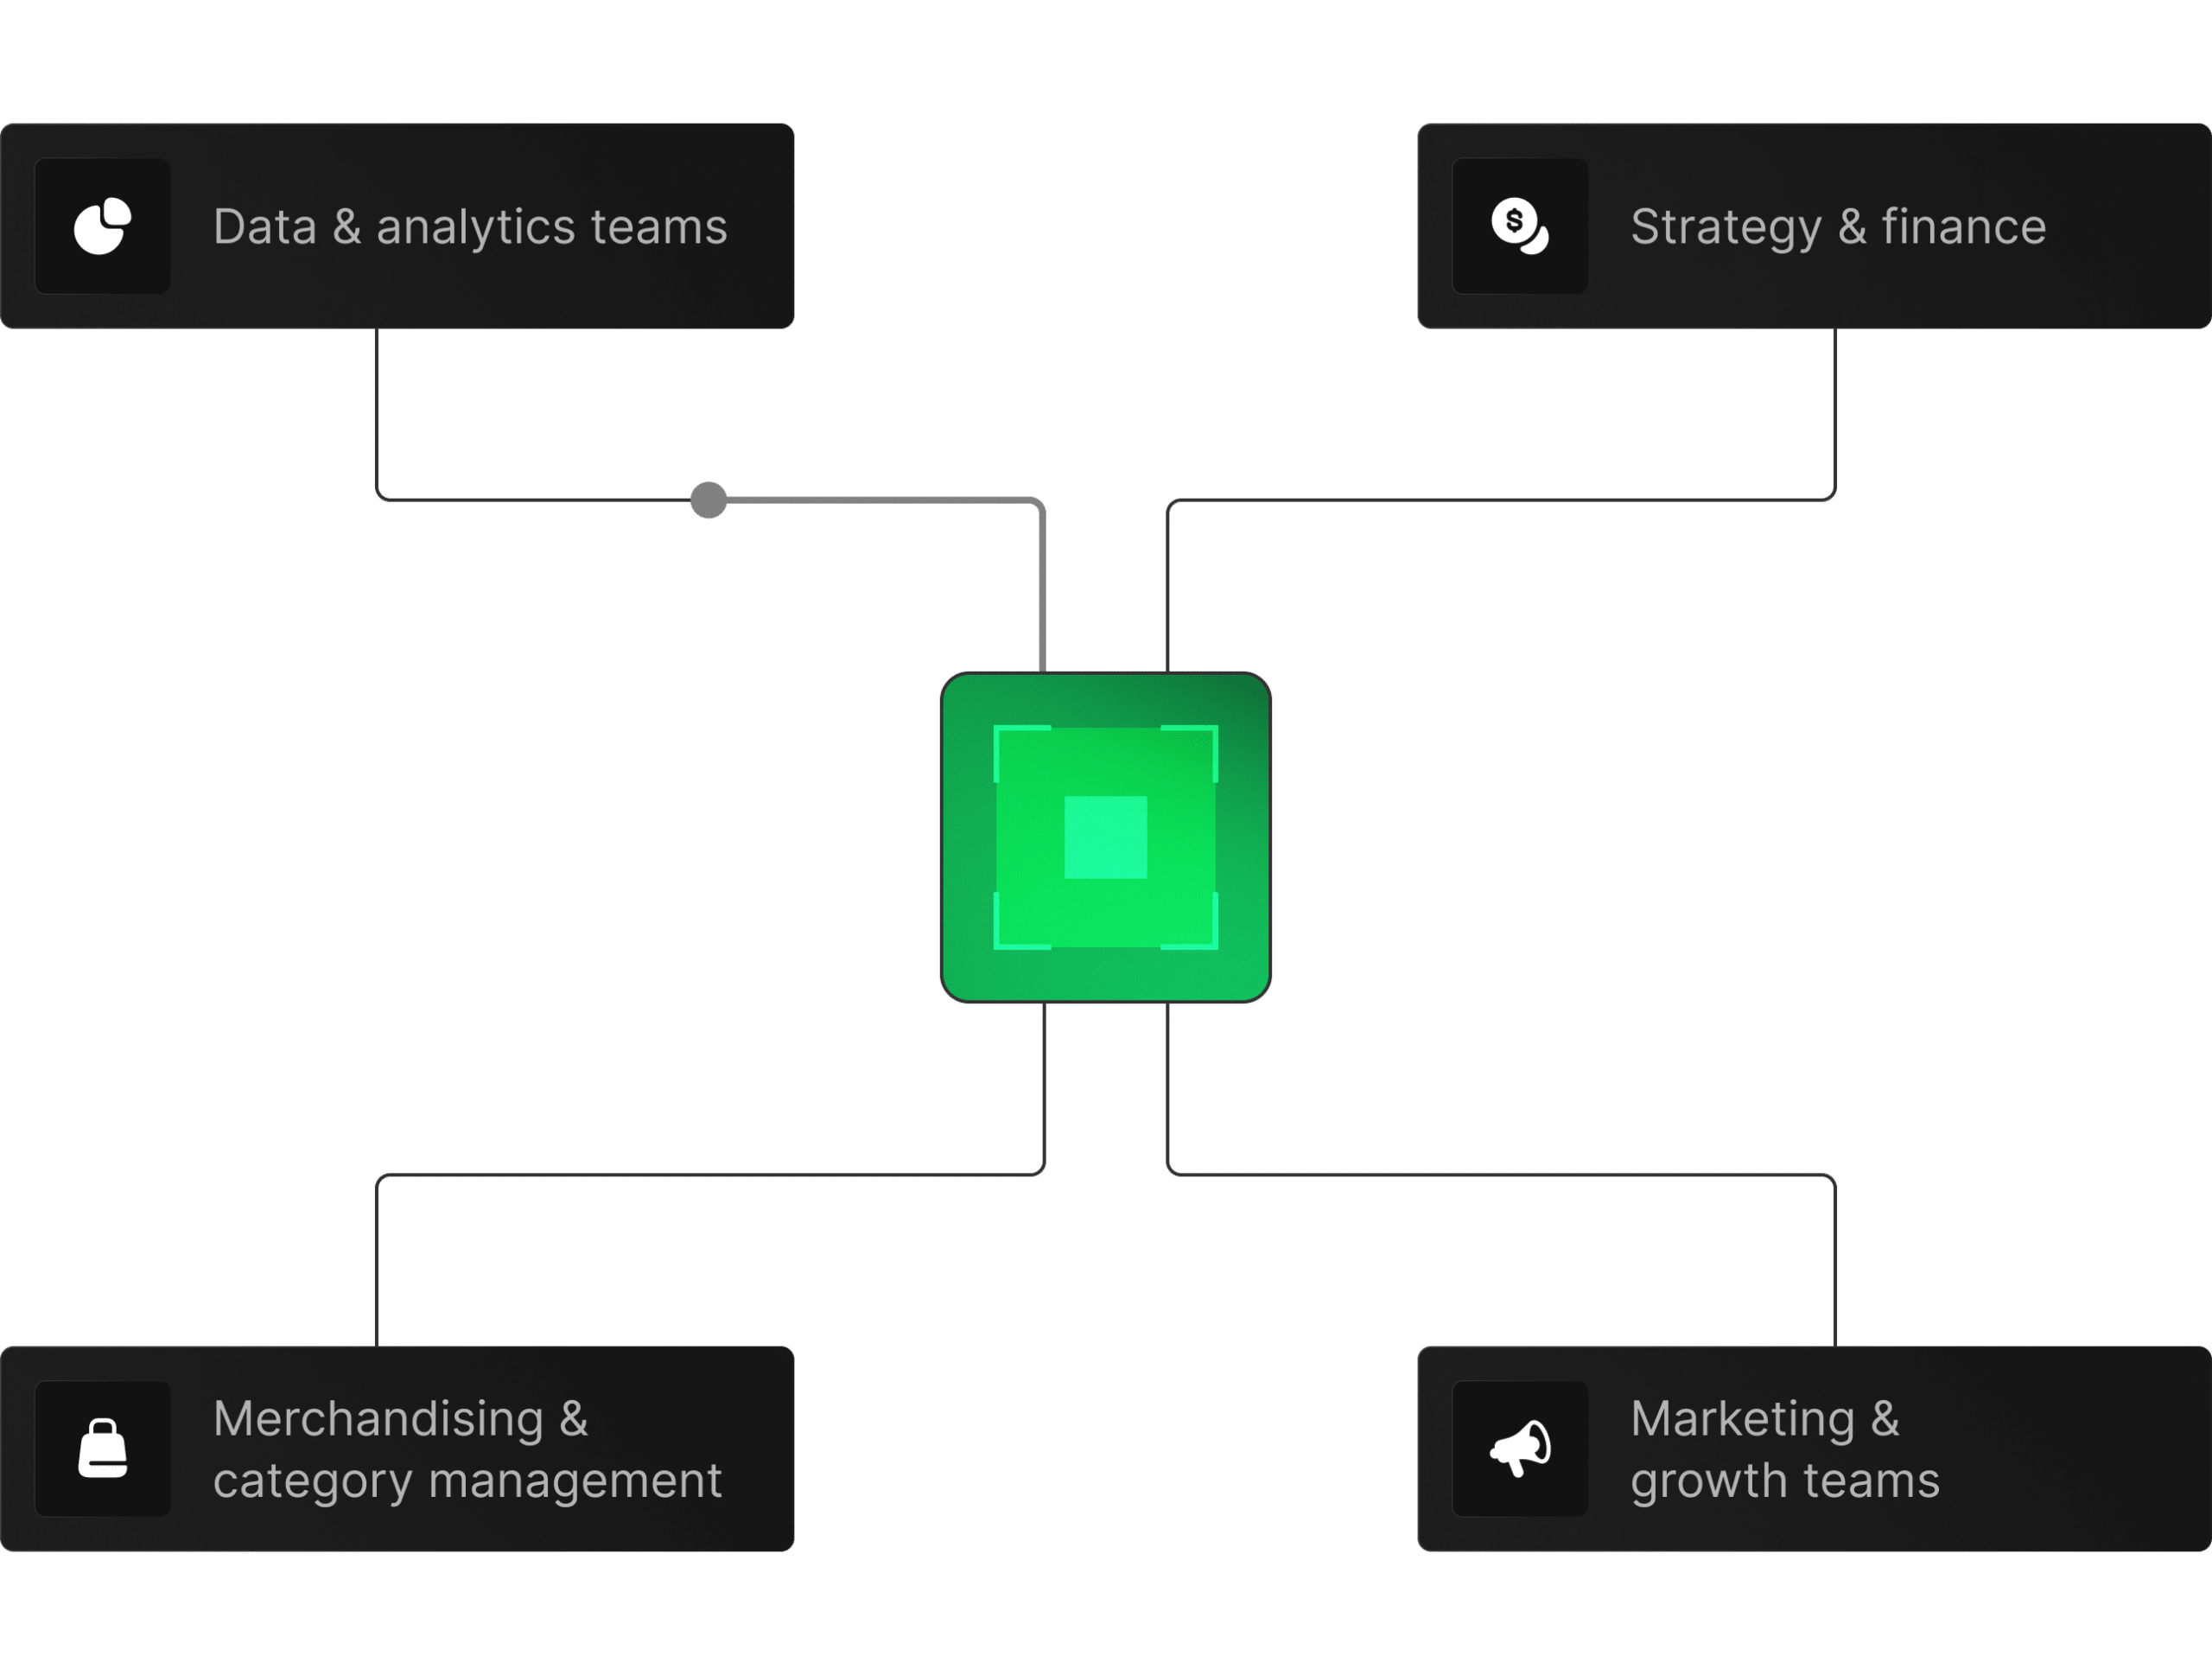
 Data & analytics teams
Looking for clean, external sales signals to add into models and dashboards.
 Merchandising & category management
 Making decisions on space, mix, and featured brands.
 Marketing & growth teams
 Planning where to focus budgets and how to tailor messaging by market.
 Strategy & finance
Assessing market health, competitive dynamics, and investment opportunities.






Tell us which regions, categories, and brands you care about.

Explore how spend, share, and momentum look across a few key markets.
Connect Retail Sales to your planning, analytics, and marketing workflows.
It shows where consumer spend concentrates across brands, categories, and markets as indexed demand signals, not reported revenue.
Spend index, category penetration, brand affinity, online vs. offline mix and purchase frequency.
Internal sales show your own performance. Aggregated Spend shows broader market demand, so you can benchmark against category and brand trends.
It adds external spend and category signals to help forecasts explain market shifts before they show up fully in internal sales.
Teams can see which categories and brands are gaining spend momentum in each market, then adjust space, mix, and emphasis accordingly.
Yes, it shows where promotions are moving spend and where competitor or category spend is shifting.
Products
Solutions By Use Case
By Use Case
By Industry
© 2026 Factori. All rights reserved.







