Talk to the real world with Factori MCP - Get Started Now
Talk to the real world with Factori MCP - Get Started Now
Factori gives supply chain and logistics teams the real‑world data they’re missing—how people move, how roads behave, how markets are changing—so you can make better decisions on networks, capacity, routes, and service levels.
Trusted by





Trusted by
Most plans assume the world is stable: demand follows history, roads behave, and markets grow evenly. In reality:
Factori adds an outside‑in view of every route, depot, and service area so you can:
Decide where to open, resize, or close nodes based on real demand, access, and growth.

Design lanes using actual congestion and incident patterns, not just distance on a map.

Plan linehaul, last‑mile, and labor using local demand and economic signals—not just last year’s volume.

Set realistic promises by area and time of day; know which zones are structurally high‑risk.

Choose the right node (store, DC, micro‑fulfillment, dark store) based on how people move and shop in each area.
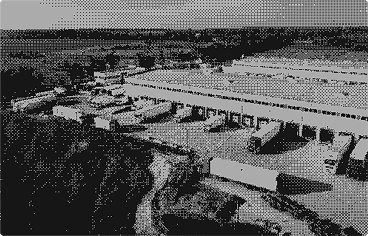
You keep your WMS, TMS, order data, and forecasts. Factori brings the real‑world layer.
All datasets are aggregated, documented, and designed to be easy to connect to your depots, lanes, zones, and customer areas.



Search and commerce interest that points to future demand by product and geography.


Aggregated view of who lives and works in each area—useful for estimating pickup, delivery, and store traffic.


What’s on the ground: stores, depots, competitors, big shippers, and demand generators.


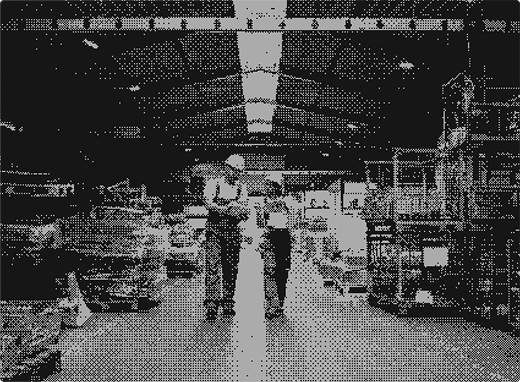

Are our depots in the right places for where demand is going, not just where it was?
Which lanes and regions are structurally high‑risk for delays and missed ETAs?
Where should we add linehaul or last‑mile capacity ahead of next season?
How will new events, competitors, or economic changes affect volume in specific areas?
Which orders and routes should get more conservative promises based on real‑world conditions?
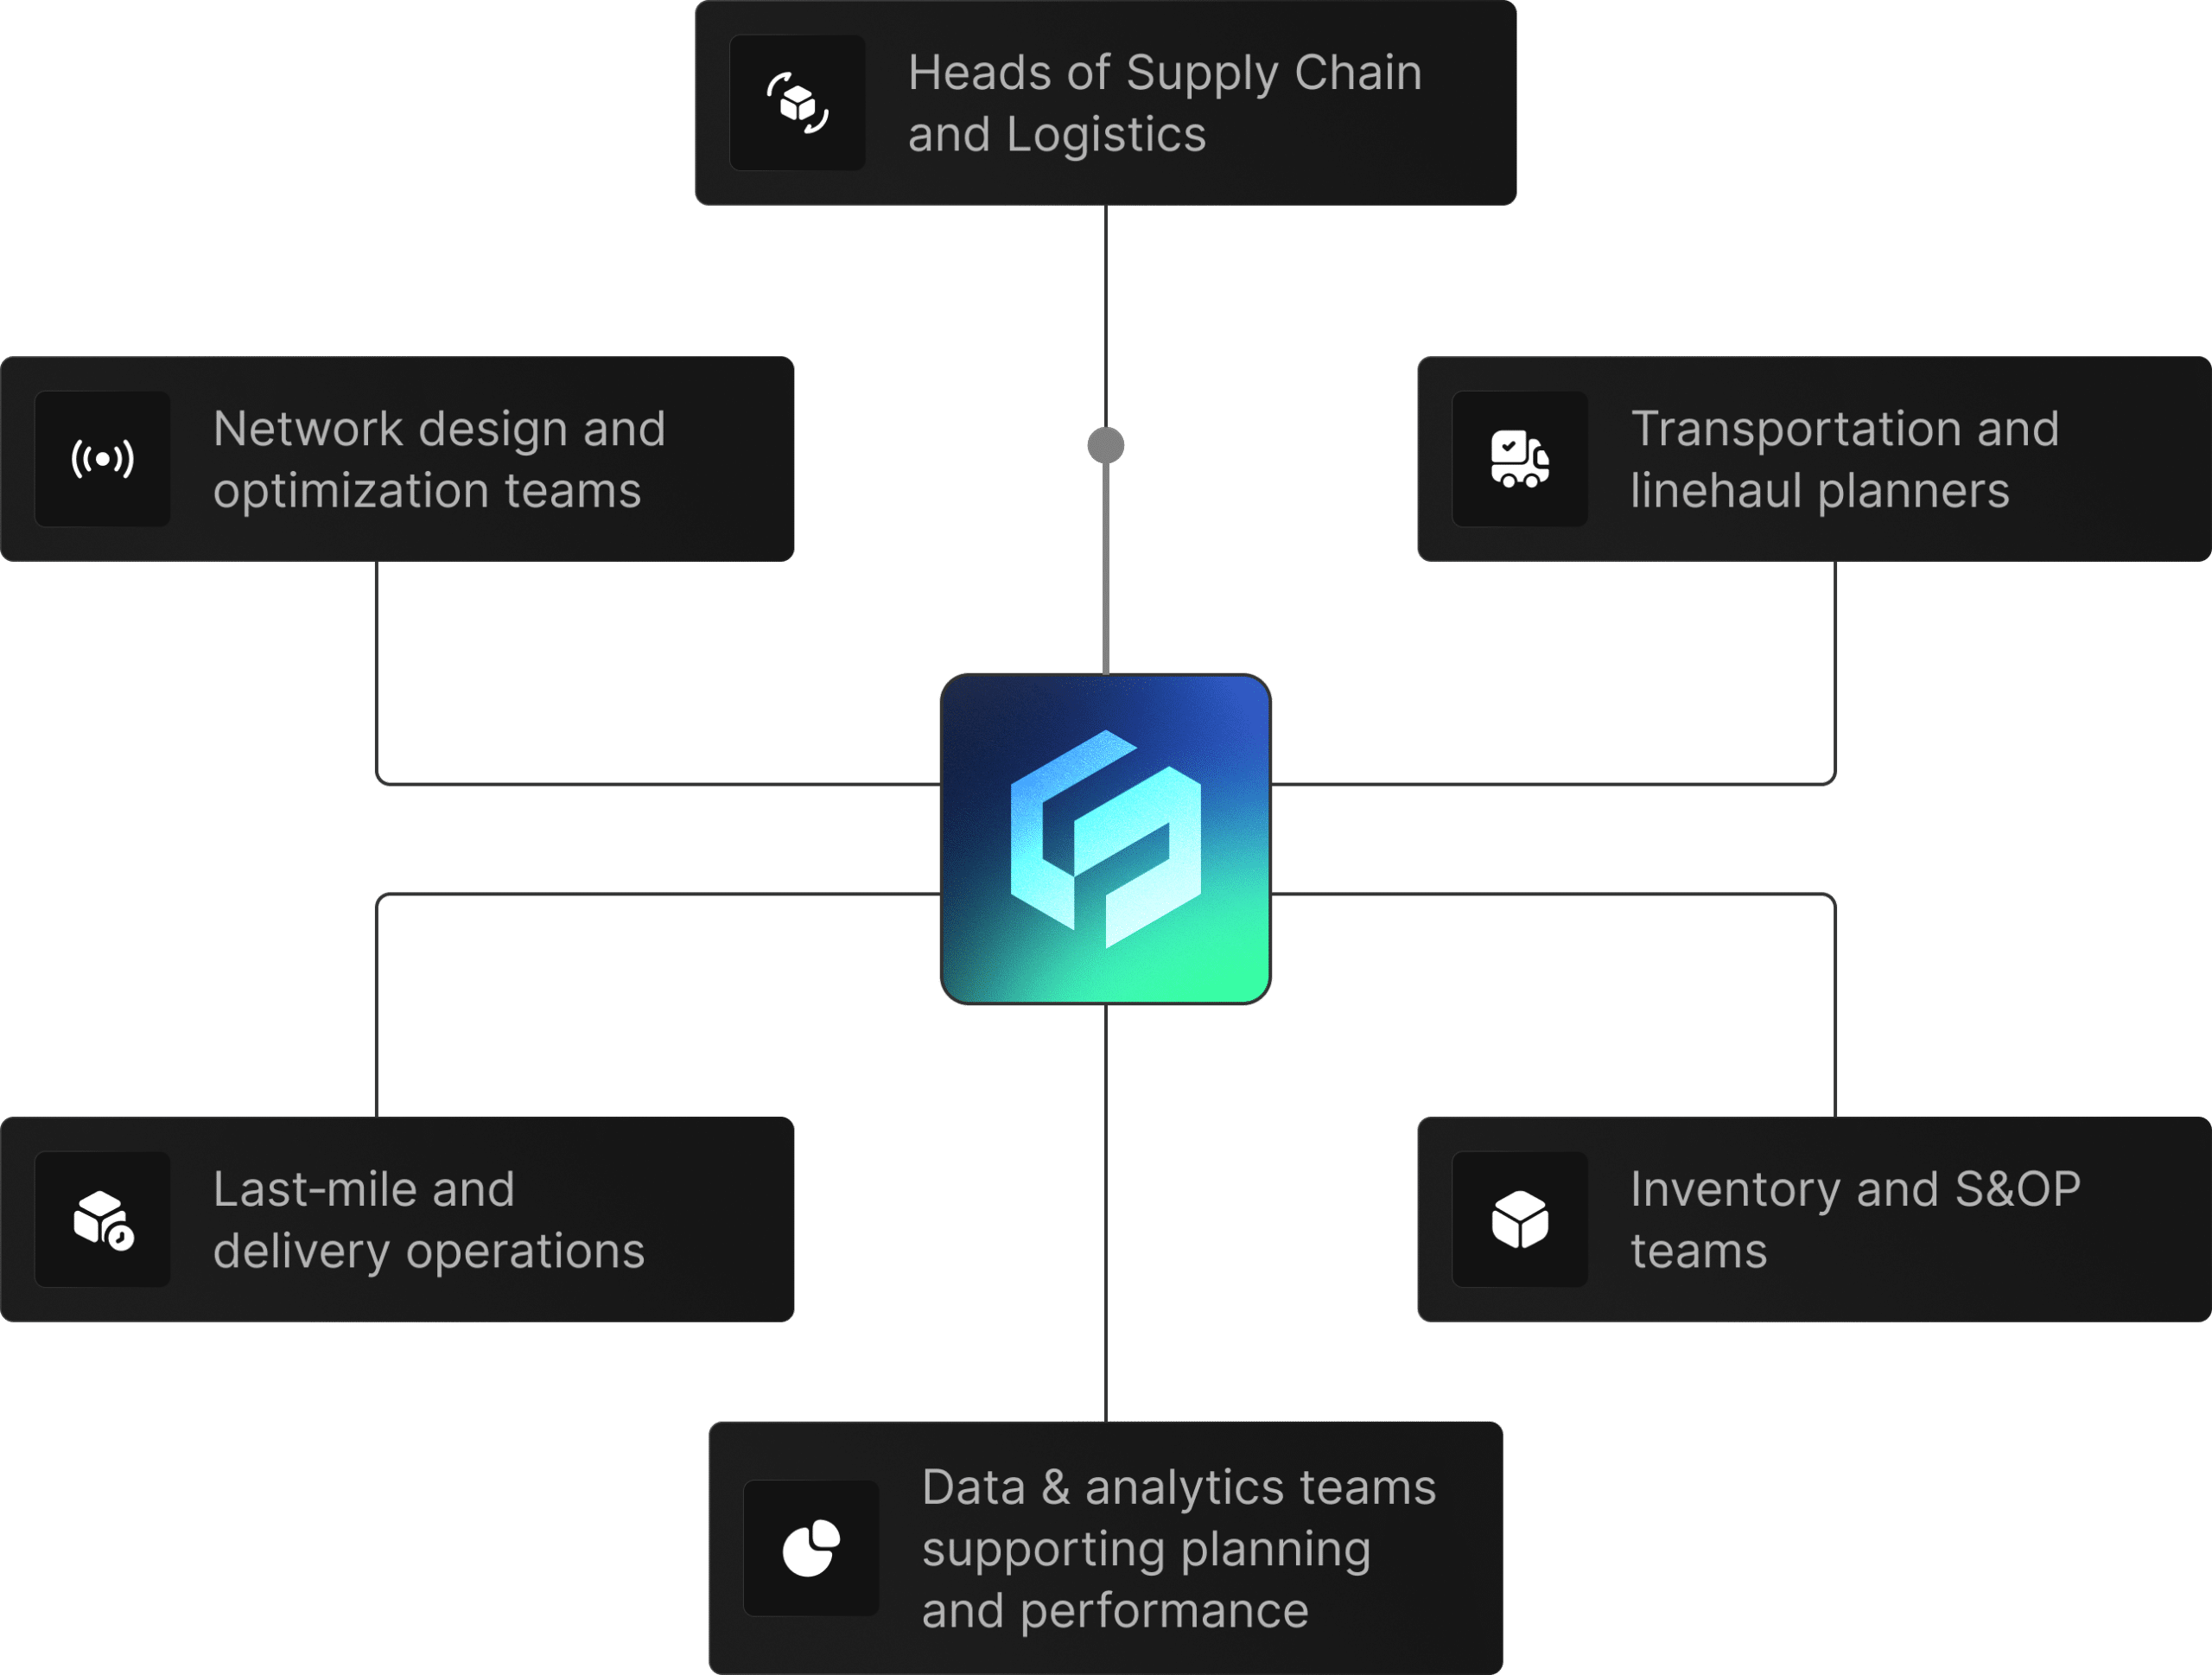
 Heads of Supply Chain and Logistics
who need error down and trust up.
 Network design and optimization teams
Looking for clean, reliable visit data to plug into models and dashboards.
 Transportation and linehaul planners
Looking for clean, reliable visit data to plug into models and dashboards.
 Last‑mile and delivery operations
Looking for clean, reliable visit data to plug into models and dashboards.
 Inventory and S&OP teams
Looking for clean, reliable visit data to plug into models and dashboards.
 Data & analytics teams supporting planning and performance
Looking for clean, reliable visit data to plug into models and dashboards.
For example: last‑mile ETA reliability in a key region, upcoming network redesign, or peak‑season planning.

Common starting point for logistics: Traffic + Mobility + Events + Retail Sales, then add People and Economic as needed.
Compare your current plans and performance with a view that includes Factori data, and decide where to adjust routes, nodes, or capacity first.
Factori helps logistics and supply chain teams improve demand sensing, route planning, depot placement, capacity planning, last-mile delivery, inventory flow, replenishment planning, and service-level forecasting with real-world external data.
Logistics and supply chain teams use Factori for volume forecasting, delivery-zone design, depot and hub planning, route optimization, lane analysis, last-mile planning, disruption monitoring, replenishment planning, and SLA protection.
Factori helps teams improve forecast accuracy, reduce cost-to-serve, optimize capacity, improve delivery-zone design, anticipate disruptions, improve asset utilization, and protect service levels across routes, depots, and markets.
Factori data can be delivered via CSV, APIs, platform access, or MCP-enabled workflows. It can connect to TMS, WMS, route planning tools, depot networks, delivery zones, BI systems, and forecasting models.
Factori uses standardized, geospatially aligned, quality-checked data for aggregate operational planning. Mobility, traffic, business, economic, and weather signals are structured for enterprise logistics use without individual-level exposure.
Products
Solutions By Use Case
By Use Case
By Industry
© 2026 Factori. All rights reserved.