Retail sales data tells you what customers buy, where they spend, and which categories are gaining ground - across markets you don't own yet. The Retail Sales dataset delivers purchase trends broken down by brand, category, and geography, so you can benchmark performance, spot shifts early, and make decisions backed by real consumer behavior.
Trusted by

Trusted by
How much consumers are spending in a category, and how that spend is distributed across brands.

Average basket size and frequency trends to understand how shoppers are behaving, not just how much they spend.

Where spend is rising, flat, or falling—by country, region, city, or neighborhood.

Simple indicators of who is gaining or losing share in each market over time.

Understand total category behavior, not just your own sales, so you can size the true opportunity.
Identify where categories are heating up or cooling down before it shows up in lagging internal reports.
Compare your trends against the broader market to see if a problem is local, category‑wide, or competitor‑specific.
Give demand planning, marketing, and finance a shared view of what’s happening in the real market.
Use market‑level category and brand trends as an extra signal to refine demand plans and explain shifts.

Allocate space and emphasis to categories and brands that are gaining momentum in each market.
Category sales data shows you where consumer spending trends are moving, so your assortment reflects what shoppers actually want, not what sold well last season.

See how competitors are performing and where promos are actually moving the needle.
Pick markets for new stores, campaigns, or investments based on proven spend, not guesswork.
Retail market share and spend trends by geography tell you exactly where demand is growing and where it's already saturated, before you commit.

Use purchase‑based outcomes to evaluate campaigns and inform next‑cycle planning.

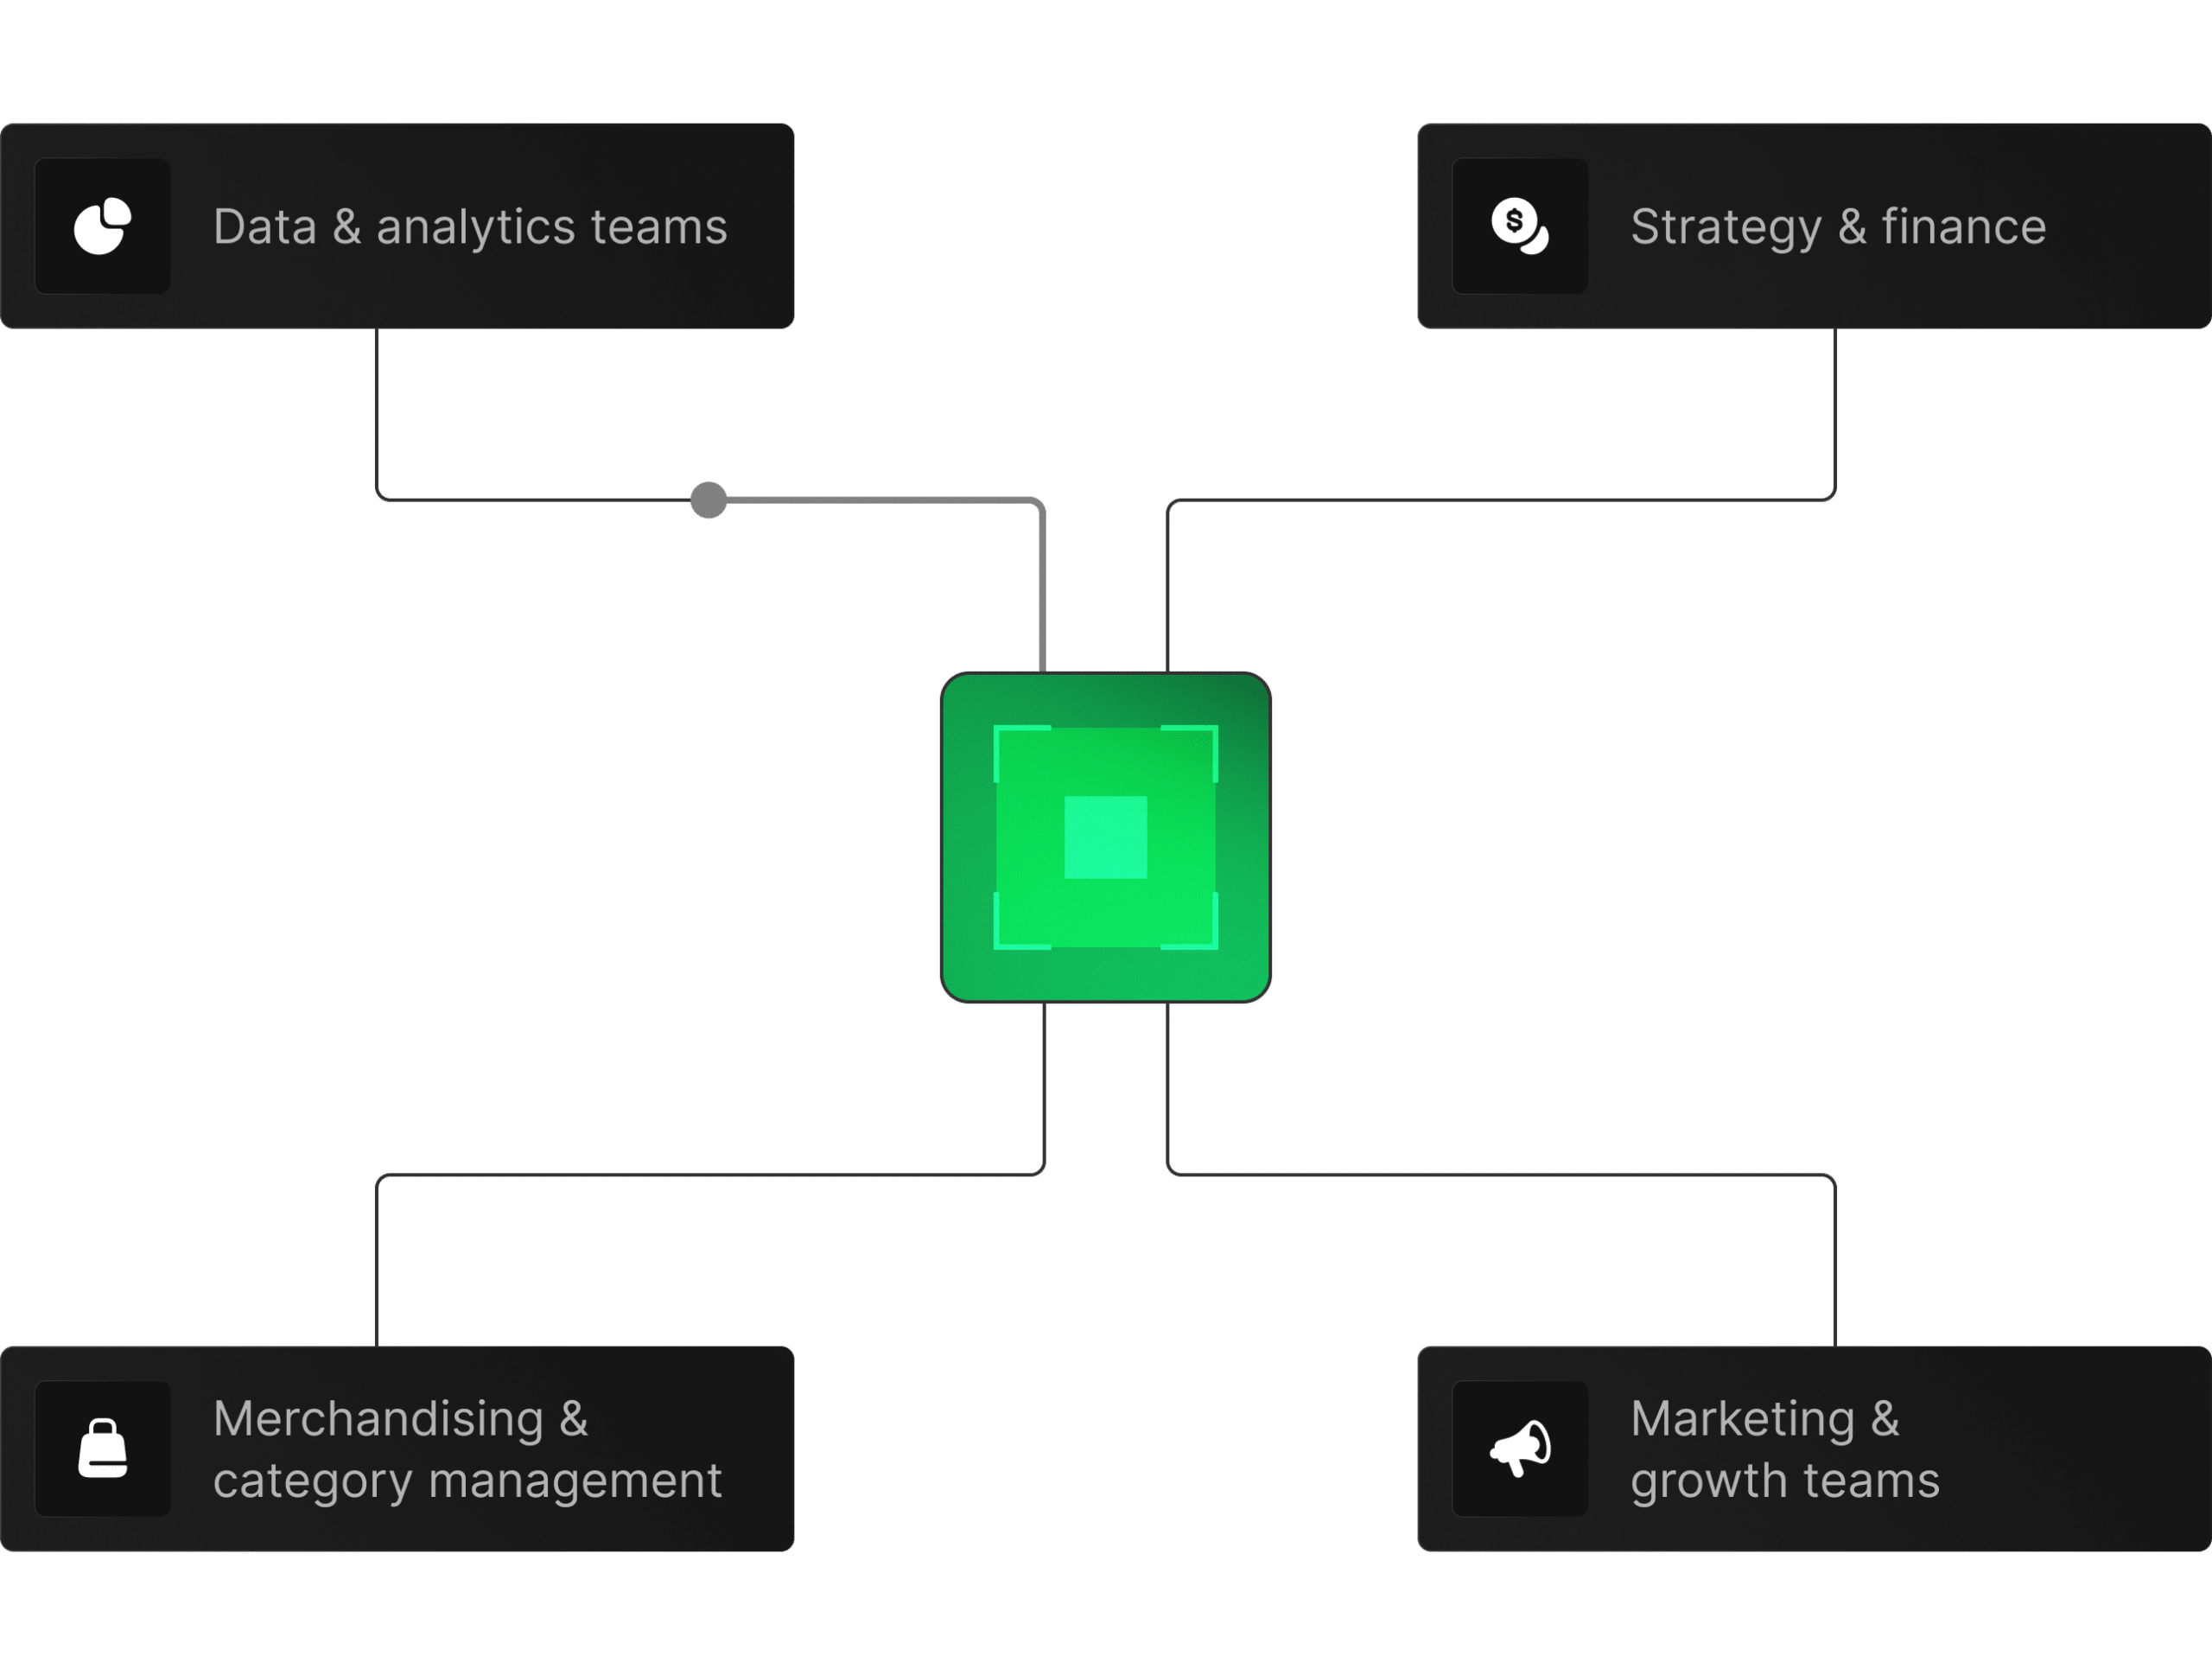
 Data & analytics teams
Looking for clean, external sales signals to add into models and dashboards.
 Merchandising & category management
 Making decisions on space, mix, and featured brands.
 Marketing & growth teams
 Planning where to focus budgets and how to tailor messaging by market.
 Strategy & finance
Assessing market health, competitive dynamics, and investment opportunities.


Tell us which regions, categories, and brands you care about.
Explore how spend, share, and momentum look across a few key markets.
Connect Retail Sales to your planning, analytics, and marketing workflows.
Factori Retail Sales Data provides market-level retail spend, category, brand, purchase, share, and momentum indicators that help businesses understand where consumer spending is rising, softening, or shifting.
Businesses use Retail Sales Data for retail demand forecasting, category planning, market benchmarking, assortment strategy, pricing analysis, promotion planning, retail media measurement, and competitive market intelligence.
Retail Sales Data adds external purchase and category signals to forecasting models, helping teams explain market shifts, competitor movement, category demand, and local retail performance beyond internal POS data.
Factori builds Retail Sales Data from aggregated purchase, spend, commerce, retail panel, category, and market intelligence sources. The data is normalized into privacy-safe trends by brand, category, geography, and time period.
Customers can access using any of these options:
(1) Download a 100-row sample CSV for FREE
(2) Connect the MCP server to your AI client and query in natural language
(3) Book a 30-minute discovery call, validate fit against a specific use case.
(4) Factori Platform
Retail Sales Data is updated based on source cadence and market availability. Depending on the use case, updates may be monthly, quarterly, or custom-scheduled for category, forecasting, and benchmarking workflows.
Internal POS data shows your own performance. Factori Retail Sales Data shows broader market behavior, category momentum, brand trends, competitive context, and spend shifts across geographies.
© 2026 Factori. All rights reserved.


