Talk to the real world with Factori MCP - Get Started Now
Talk to the real world with Factori MCP - Get Started Now
Factori gives real estate owners, REITs, and developers a clear view of the world around each asset—who’s there, what’s nearby, how people move, and how markets are changing—so you can make better calls on underwriting, leasing, and growth.
Trusted by





Trusted by
Spreadsheets rarely capture what makes a location work (or fail).
Most decisions are built on:
Factori adds a consistent outside‑in view, so you can:
Evaluate potential sites by real‑world demand, audience, and business mix—not just basic comps.
Match tenant mix and categories to the local customer base and movement patterns.

Decide where to renovate, re‑tenant, or change formats based on neighborhood direction.

See which assets are in strengthening, stable, or softening locations and act early.

Support stories about “why this location” with tangible external data, not just photos and anecdotes.
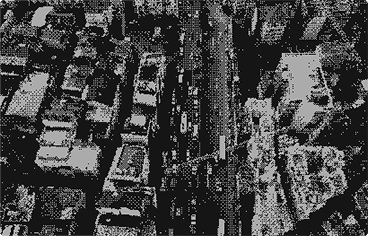
You bring your asset data and financials. Factori brings the real‑world layer.
All datasets are aggregated and designed to be easy to read, compare, and join to your assets and markets.



Competitive and complementary business mix around each asset, center, or corridor.


Search and commerce interest in brands, products, and experiences by geography.


Which sites actually look most like our best‑performing assets in the real world?
Where should we prioritize new development or redevelopment over the next 3–5 years?
How is the neighborhood around this center changing—getting younger, more affluent, denser?
Which assets are in locations where retail and restaurant spending is growing vs. shrinking?
What tenant mix makes sense for this center given who lives, works, and moves nearby?

 Owners, REITs, and asset managers
 Development and acquisitions teams
 Leasing and merchandising teams
 Investment sales and capital markets teams
 Strategy, research, and analytics teams
 Lenders and investment partners seeking better location context
For example: upcoming acquisitions, a redevelopment pipeline, or a specific region.

Common starting point for real estate: Places + Business + People + Property + Economic, then add Mobility, Retail Sales, and Market as needed.
Compare how you evaluate sites today vs. how decisions look with real‑world data, and decide where to adjust underwriting, leasing, or investment priorities.
Factori helps real estate teams evaluate locations, trade areas, assets, neighborhoods, and investment opportunities using property, mobility, places, people, economic, business, and market intelligence.
Real estate teams use Factori for site selection, trade area analysis, asset evaluation, tenant strategy, competitor mapping, redevelopment planning, market screening, portfolio review, investment analysis, and location scoring.
Factori helps teams identify stronger locations, reduce poor site decisions, understand neighborhood momentum, evaluate demand drivers, compare markets, explain asset performance, and prioritize expansion or investment opportunities.
Factori data can be accessed through CSV, APIs, platform workflows, or MCP-enabled access. It can connect to assets, parcels, properties, trade areas, GIS tools, BI dashboards, valuation models, and site selection workflows.
Factori applies geospatial validation, normalization, deduplication, and quality checks across property, mobility, places, and market datasets. Privacy-sensitive datasets are aggregated for responsible location intelligence and real estate analytics.
Products
Solutions By Use Case
By Use Case
By Industry
© 2026 Factori. All rights reserved.