Details on land parcels, buildings, density, housing mix, and how neighborhoods are changing over time. So you can make better calls on sites, formats and investment across any market you're entering.
Trusted by

Trusted by
The mix of residential, retail, office, industrial, and mixed‑use around your locations.

Area‑level view of owners vs renters, and how “dense” or spread out housing is.

Whether an area is mostly single‑family homes, low‑rise apartments, high‑rises, or commercial strips.
Simple indicators of housing stress, vacancies, and crowding that help you understand stability and pressure.

Where development, infill, and redevelopment are happening, and where things are relatively static.
Everything is delivered in a simple, comparable way so you can line up properties, neighborhoods, and markets side by side.
Make sure your concept fits the surrounding built environment and housing mix.
When two locations behave differently, see if property and neighborhood structure is part of the story.
See where new development or stress is building before it fully shows up in your numbers.
Give real estate, operations, and finance a shared, objective view of what’s on the ground.
Pick locations and formats that match the surrounding housing mix and land use profile, not just foot traffic averages.
Real estate site selection decisions get sharper when property data tells you whether an area is dense residential, mixed-use, or shifting toward new development before you commit to a lease
Real estate data on building density, vacancy signals, and development activity gives asset managers and investors a more grounded view of neighborhood trajectory than market sentiment alone.

Balance growth across urban, suburban, and emerging corridors using neighborhood data that shows how the built environment is actually changing.
Neighbourhood analysis across your current and candidate markets helps you identify where population density, housing mix, and land use are shifting in your favor — before competitors do.

Use property context to refine expectations for visit patterns, basket size, and visit frequency across your network.
Built environment data, housing density, land use mix, development signals, explains a meaningful share of why demand differs between two locations that look similar on paper.
Property intelligence at the neighborhood level helps logistics teams right-size capacity and plan routes around how areas are actually built, not just how they're zoned on a map.
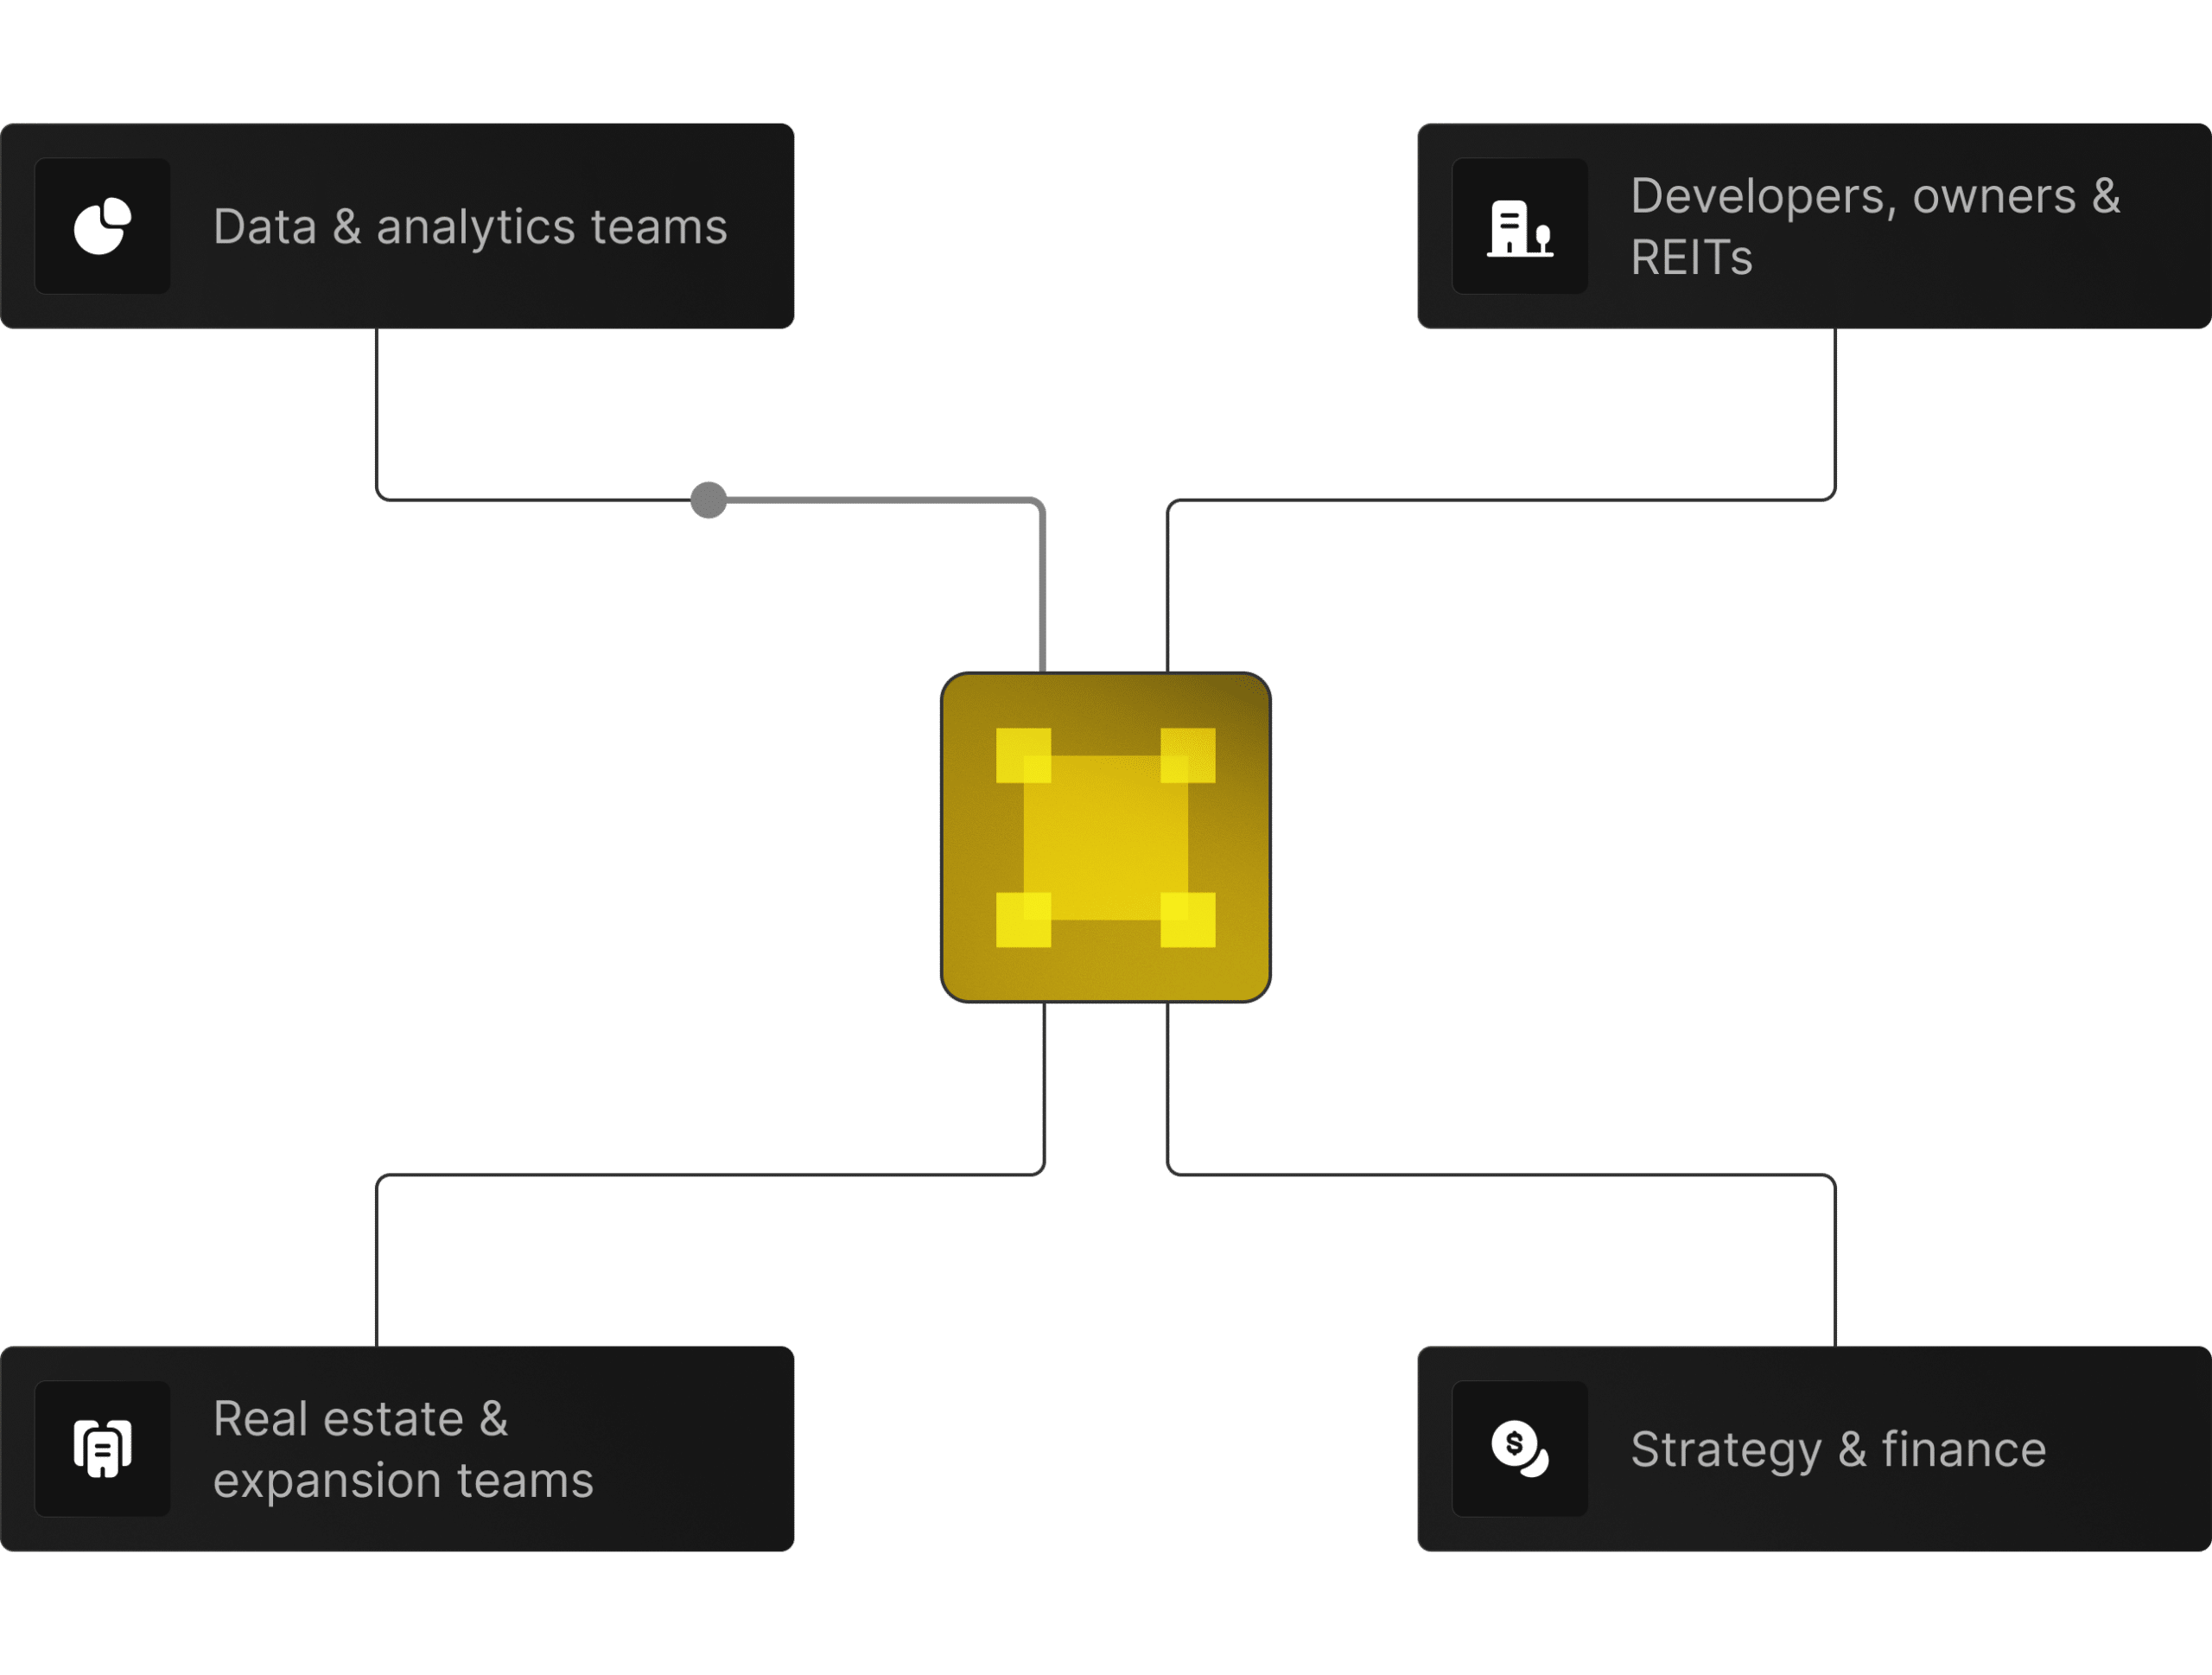
 Real estate & expansion teams
Choosing where to open, upgrade, or close locations.
 Developers, owners & REITs
 Evaluating neighborhood trajectory and asset positioning.
 Strategy & finance
 Stress‑testing growth plans and underwriting against local physical reality.
 Data & analytics teams
Adding a clean, consistent view of the built environment to models and dashboards.


Tell us which stores, branches, assets, or regions you care about.
Explore Property data for a few key areas and see how it matches what you know on the ground.
Make Property part of how you evaluate sites, review performance, and plan growth.
Factori Property Data turns the built environment into structured intelligence for site selection, real estate strategy, demand forecasting, investment analysis, network planning, and market evaluation.
Property Data creates value in real estate planning, site selection, market expansion, asset strategy, network planning, investment analysis, neighborhood comparison, and demand forecasting. It helps teams understand how the built environment shapes local demand.
Property Data helps teams understand land use, housing mix, building density, property type, development change, vacancy, and neighborhood structure around each location or candidate site.
Factori builds Property Data from property records, land use sources, housing datasets, building footprints, planning data, real estate sources, government records, and geospatial layers. These are cleaned, standardized, and joined to locations, markets, and trade areas.
Customers can access using any of these options:
(1) Download a 100-row sample CSV for FREE
(2) Connect the MCP server to your AI client and query in natural language
(3) Book a 30-minute discovery call, validate fit against a specific use case.
(4) Factori Platform
Property Data is updated based on source availability and market cadence. Some property and development indicators may refresh monthly or quarterly, while structural housing and land-use indicators may update less frequently.
Property context helps explain why demand differs across locations. Housing density, land use, development activity, vacancy, and neighborhood change can affect foot traffic, service demand, delivery demand, basket size, and long-term market potential.
Choose your stores, assets, regions, or target markets, and Factori can prepare a Property sample for review and planning.
© 2026 Factori. All rights reserved.


