A retail location may look attractive because it has a large nearby population, strong road access, or limited visible competition.
But those factors do not always show where customers actually come from, how often they visit, or whether the location can support steady demand.
Catchment area analysis helps retailers understand the real market around an existing or proposed store. By combining geographic boundaries with mobility, visit, POI, and customer data, businesses can compare locations, understand customer reach, and reduce the risk of poor expansion decisions.
Key Takeaway
- Catchment area analysis helps retailers understand where customers actually come from, not just who lives within a fixed radius.
- Radius, travel-time, and mobility-based catchments answer different questions, but observed mobility provides the clearest view of real customer behavior.
- Strong catchment analysis combines mobility, visit, POI, people, market, and accessibility data to evaluate customer reach and market potential.
- Retailers can use catchment analysis to compare sites, identify underserved markets, assess competitor overlap, and reduce cannibalization risk.
- The strongest site decisions consider both the size of the catchment and the quality of demand within it.
What Is Catchment Area Analysis?
Catchment area analysis is the process of defining the geographic area from which a location attracts, or is expected to attract, customers.
A catchment area is also often called a trade area.
It may cover the neighborhoods around a retail store, the towns around a shopping center, or a much wider region for a destination location.
Retailers use catchment area analysis to answer questions such as:
- Where do current customers come from?
- How large is the addressable customer base?
- Which areas generate the most store visits?
- How much competition exists in the market?
- Will a new store attract new customers or overlap with an existing location?
A catchment boundary alone does not show whether a market is commercially attractive.
Retailers also need to understand movement, demand, access, competition, and audience fit.
The Three Main Types of Catchment Areas
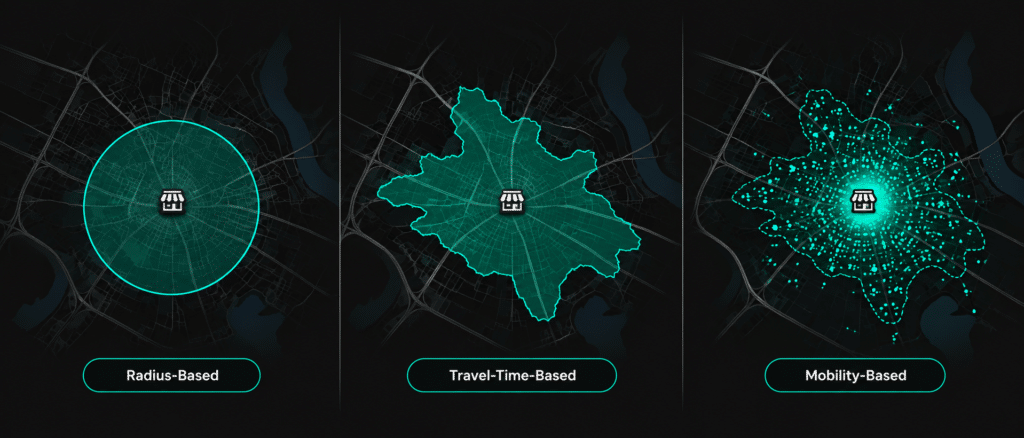
Businesses can define catchment areas in different ways.
| Catchment Method | How It Works | Main Limitation |
|---|---|---|
| Radius-based | Draws a fixed circle around a location | Ignores roads, barriers, travel time, and customer behavior |
| Travel-time-based | Maps areas that can reach a location within a set journey time | Shows accessibility, not actual visits |
| Mobility-based | Uses observed movement and visit patterns to show where visitors come from | Requires accurate, privacy-safe mobility data |
Radius-Based Catchments
A radius-based catchment may include everyone within three, five, or ten kilometers of a store.
It is simple and useful for early market screening.
However, people within the same radius may have very different access to the store. Roads, rivers, railways, congestion, and public transport can all change how easy the location is to reach.
Travel-Time Catchments
Travel-time catchments show the areas that can reach a location within a set period, such as 10, 20, or 30 minutes.
This gives a more realistic view of accessibility.
But it still does not show whether people actually visit the location.
Mobility-Based Catchments
Mobility-based catchments use aggregated movement and visit patterns to show where customers travel from in the real world.
For existing stores, this can give a clearer picture of actual customer reach.
For proposed locations, mobility signals can be combined with nearby store performance, local market conditions, and customer profiles to estimate potential demand.
What Data Is Needed for Catchment Area Analysis?
A reliable catchment analysis usually combines several data layers.
| Data Type | What It Helps Reveal |
|---|---|
| Mobility and visit data | Visitor origins, frequency, dwell time, daypart behavior, and movement |
| POI data | Competitors, nearby businesses, retail clusters, amenities, and destinations |
| People and market data | Population traits, household profiles, income indicators, and audience fit |
| Accessibility data | Roads, transport, parking, pedestrian access, and physical barriers |
Mobility and Visit Data
Mobility and visit data helps retailers understand how customers move between places.
It can show which neighborhoods generate visits, how far customers travel, and whether a store attracts mainly local or destination traffic.
It can also reveal weekday and weekend differences, peak visit times, and repeat visitation.
POI Data
POI data adds context around the businesses and destinations within a catchment.
Retailers can use it to understand competitors, nearby businesses, shopping centers, commercial clusters, offices, schools, transit hubs, and leisure destinations.
A location surrounded by relevant destinations may attract more demand than an isolated site with a similar population.
People and Market Data
People and market data helps determine whether the local population matches the retailer’s target customer profile.
A large catchment may still be weak if household structure, income, interests, or spending potential do not match the brand.
Accessibility Data
Accessibility shows how easy it is for customers to reach a store.
Road quality, parking, public transport, pedestrian access, congestion, and physical barriers can all affect visits.
Two sites with similar population coverage may perform very differently because of access.
How to Conduct a Catchment Area Analysis
A structured catchment area analysis can be completed in five steps.
1. Define the Business Objective
Start with the decision the analysis needs to support.
This may include evaluating a new store, comparing shortlisted sites, benchmarking existing locations, identifying underserved markets, redesigning a retail network, or measuring cannibalization.
The objective determines which catchment method, datasets, and metrics are needed.
2. Select the Catchment Method
Choose whether to use radius, travel time, observed mobility, or a combination.
Radius and travel-time catchments are useful for early screening.
Mobility-based catchments are more useful when the goal is to understand real customer behavior or validate store performance.
3. Map Customer Origins and Accessibility
For existing locations, identify where visitors come from and how far they travel.
For proposed locations, estimate which customers can realistically access the site.
This should include road networks, travel time, transport links, parking, and physical barriers.
Catchments can also be grouped into primary, secondary, and tertiary zones based on how much demand they generate.
4. Enrich the Catchment With Market Data
Add customer, POI, competition, and market information to each catchment.
This helps show whether the area contains enough relevant demand.
It can also reveal whether competitors already serve the same audience or whether the location fills a market gap.
5. Compare Locations and Validate the Opportunity
Use the same metrics to compare each site.
Important measures may include addressable population, customer fit, visit potential, competitor concentration, accessibility, existing store overlap, nearby destination strength, and market coverage gaps.
The final decision should consider both customer reach and the quality of the opportunity.
What Catchment Area Analysis Reveals About a Location
Catchment area analysis shows more than the size of the surrounding market.
It can help retailers understand where customers are likely to come from, how far they are willing to travel, which segments are present, and whether nearby destinations strengthen the site.
It can also show which competitors attract the same audience and whether a new location will add coverage or create overlap.
For example, one site may have a larger nearby population. Another may have stronger customer movement, easier access, and a better match with the retailer’s target audience.
This is why population density alone should not determine site potential.
Common Catchment Area Analysis Mistakes
Using a Fixed Radius as the Final Answer
A radius is easy to create, but it may not reflect actual travel patterns or customer behavior.
Treating Everyone in the Catchment as a Customer
Not every resident or visitor has the same chance of visiting a store.
Customer fit, income, interests, and travel behavior all matter.
Ignoring Competitors and Nearby Destinations
Competitors can reduce available demand.
At the same time, complementary businesses may make the area more attractive and increase visits.
Both should be considered.
Assuming Catchments Stay the Same
Customer movement changes as roads, businesses, competitors, and residential areas change.
Catchment areas should be reviewed over time.
How Factori Supports Catchment Area Analysis
Factori helps businesses evaluate catchment areas using privacy-safe real-world data about people, movement, and places.
Retailers can combine aggregated mobility and visit intelligence, global POI and business data, people and audience attributes, location and market insights, and platform or API access.
These datasets help teams move beyond simple map boundaries and evaluate actual customer reach, competitor overlap, audience fit, and market potential.
Factori’s data can support site selection, trade area analysis, network planning, store benchmarking, and market expansion.
Conclusion
Catchment area analysis helps retailers understand the real market around a location.
The strongest analysis combines geographic boundaries with mobility, visit, POI, customer, and accessibility data.
This helps businesses compare sites more accurately, identify underserved markets, reduce cannibalization risk, and make better expansion decisions.
FAQs
What Is the Difference Between a Catchment Area and a Trade Area?
The terms are often used in the same way.
Both describe the geographic area from which a store or destination attracts customers. “Trade area” is more common in retail, while “catchment area” is also used in transport, healthcare, education, and public services.
How Is a Retail Catchment Area Calculated?
A retail catchment can be calculated using distance, travel time, customer addresses, transaction records, or aggregated mobility data.
Many businesses combine several methods to compare theoretical reach with observed customer behavior.
What Data Is Used in Catchment Area Analysis?
Common data includes mobility, visit intelligence, POI data, people and demographic data, market indicators, road networks, transport access, and competitor locations.
How Often Should a Catchment Area Be Updated?
Catchment areas should be reviewed when major market changes occur.
Examples include new store openings, road development, population growth, new competitors, or changes in customer behavior.
Can Catchment Area Analysis Identify Store Cannibalization?
Yes. By comparing visitor origins, customer profiles, travel patterns, and overlapping catchments, retailers can estimate whether a proposed store is likely to attract new demand or pull customers from an existing location.