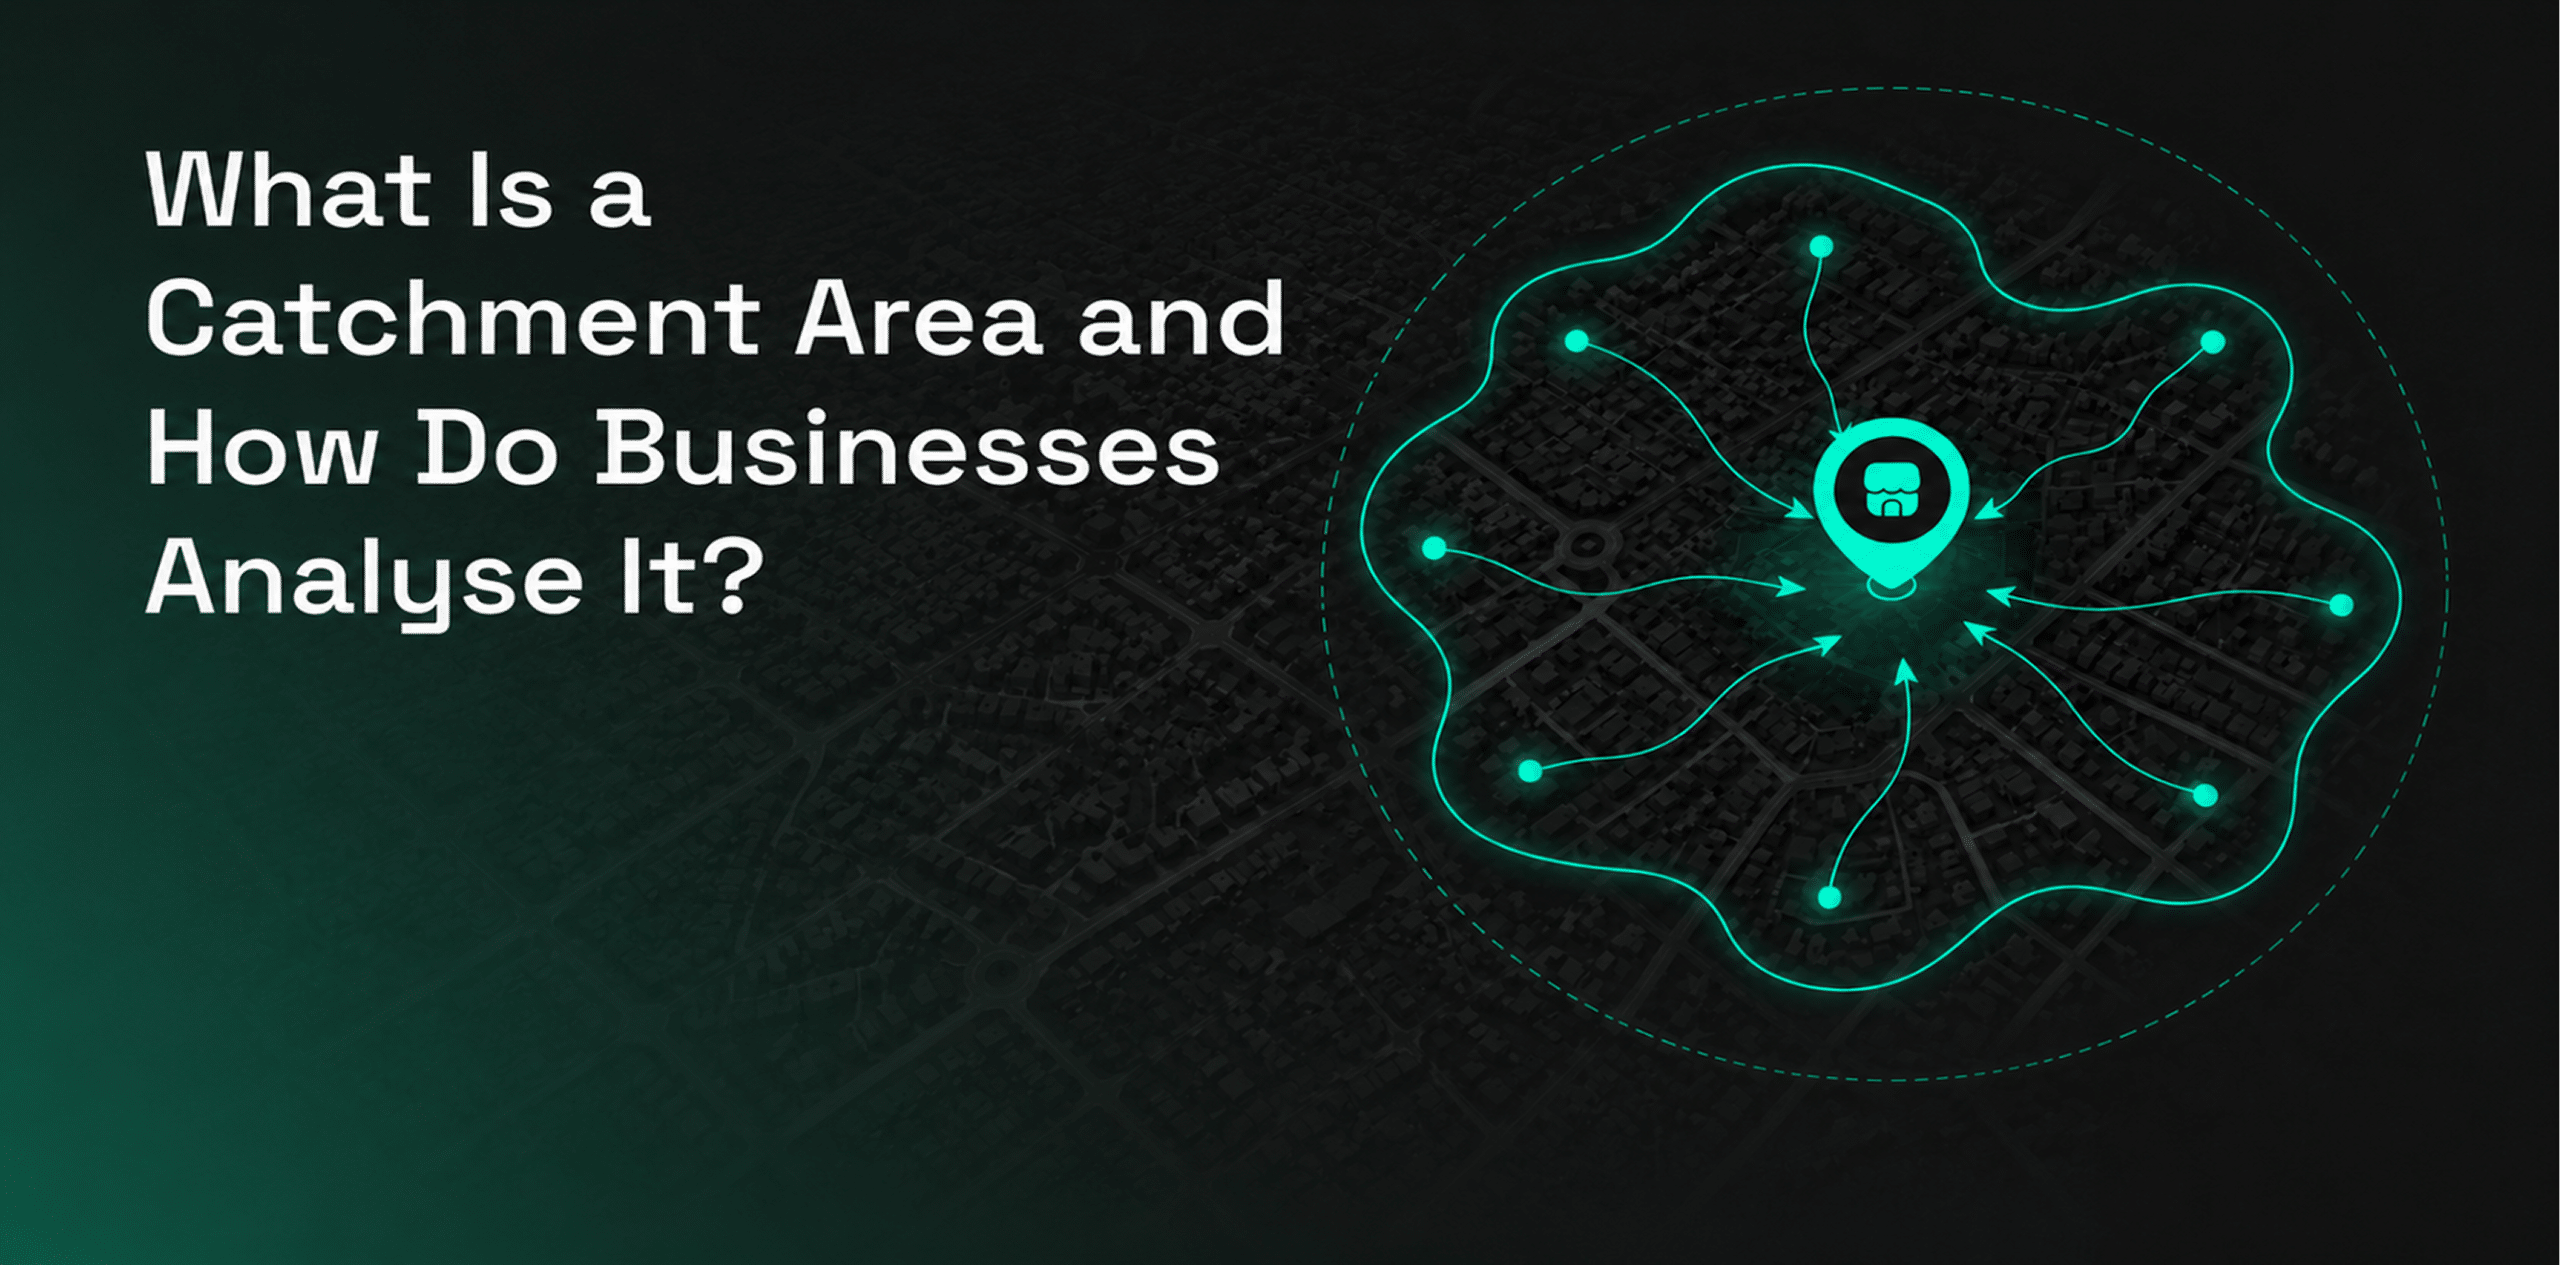
A catchment area is the geographic area from which a business, store, branch, or service location attracts its customers or users.
For retailers and other location-based businesses, understanding the catchment area helps show where demand comes from, how far customers travel, which competitors influence behavior, and whether a location can support future growth.
Modern catchment area analysis goes beyond drawing a simple radius around a site. It combines accessibility, mobility, visit patterns, places, and population data to create a more realistic view of market potential.
Key Takeaway
- Catchment areas show the real geographic market a location serves, including where customers come from and how far they travel.
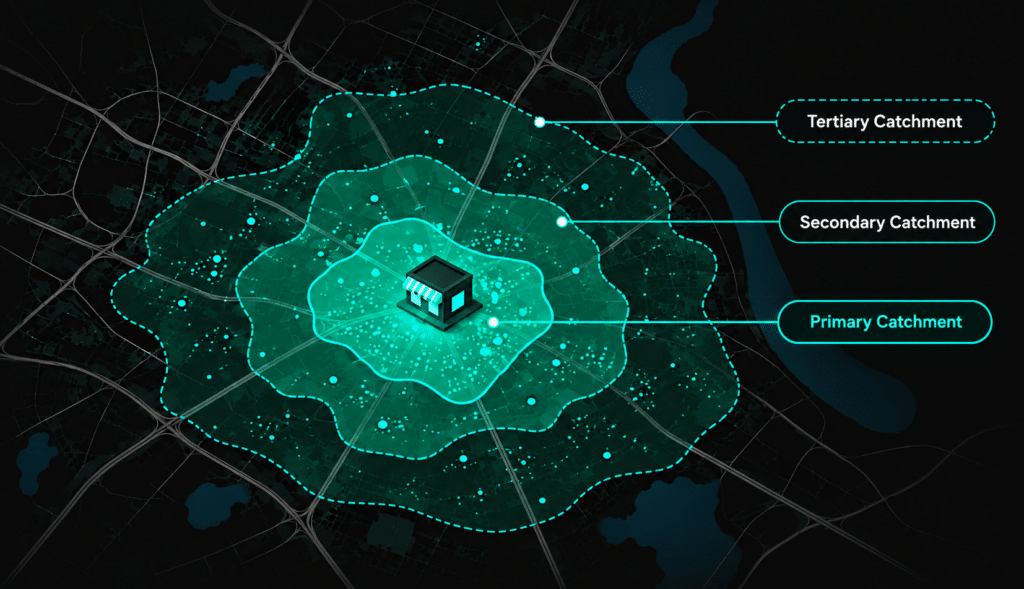
- Primary, secondary, and tertiary catchments help businesses understand which areas contribute the most demand and which contribute less frequent visits.
- Fixed-radius catchments are simple, but travel-time and mobility-based catchments usually provide a more realistic view of accessibility and customer behavior.
- Strong catchment area analysis combines mobility, visit, places, people, market, and accessibility data to understand demand more accurately.
- Catchment insights can improve site selection, store network planning, local marketing, performance analysis, and cannibalization assessment.
What Is a Catchment Area?
A catchment area is the area around a location from which most customers, visitors, or users come.
The term is commonly used in retail, real estate, healthcare, education, banking, hospitality, and public services.
In retail, a catchment area may include the neighborhoods, districts, or cities from which customers travel to visit a store.
Catchment areas are also called trade areas, trading areas, market areas, or customer origin areas.
The size and shape of a catchment area depend on several factors. These include the type of business, customer demand, accessibility, transport networks, competition, store format, and local population.
A convenience store may attract customers from a small nearby area. A shopping mall, flagship store, or specialist retailer may attract visitors from much farther away.
What Is Catchment Area Analysis?
Catchment area analysis is the process of identifying and evaluating the geographic market served by a location.
It helps businesses answer questions such as:
- Where do customers come from?
- How far do they travel?
- Which areas generate the most visits?
- Which competitors operate nearby?
- How much demand can the location capture?
- Does the site overlap with another store?
Businesses use catchment area analysis to improve site selection, evaluate store performance, improve local marketing, identify expansion opportunities, and reduce cannibalization risk.
Types of Catchment Areas
Catchment areas can be grouped by customer contribution or by the method used to calculate them.
| Catchment Type | What It Represents |
|---|---|
| Primary catchment | The area that generates the largest share of customers or visits |
| Secondary catchment | A wider area that contributes a smaller but still important share |
| Tertiary catchment | Areas that generate occasional or less frequent visits |
| Distance-based catchment | A fixed-radius area around a location |
| Travel-time catchment | Areas reachable within a set walking, driving, or transit time |
| Mobility-based catchment | Areas based on aggregated visitor origins and observed movement |
Primary, secondary, and tertiary catchments are often based on customer or visit contribution.
For example, the primary catchment may include the areas that generate most store visits. The tertiary catchment may include customers who travel from farther away.
The exact split should be based on observed behavior rather than fixed assumptions.
How Businesses Determine a Catchment Area
A reliable catchment area should reflect how customers actually reach and interact with a location.
1. Select the Location
Start with the location being analyzed.
This may be an existing store, candidate site, shopping center, restaurant, bank branch, competitor location, or proposed development.
The goal should also be clear.
A business may want to assess market potential, compare sites, measure overlap, or understand store performance.
2. Analyze Accessibility
Accessibility affects how easily customers can reach a location.
Businesses should consider walking and driving time, public transport, road networks, traffic conditions, parking, physical barriers, and entry or exit points.
Two customers may live the same distance from a store but have very different travel times.
Road layouts, congestion, rivers, railway lines, and limited access can all change how easy a site is to reach.
3. Add Real-World Data
Real-world data helps businesses move from estimated catchments to behavior-based catchments.
Useful inputs may include aggregated mobility patterns, visitor origins, visit frequency, daypart activity, nearby competitors, complementary businesses, population characteristics, and local market conditions.
These signals help show how people move through an area and which locations influence their decisions.
4. Compare and Validate the Catchment
The estimated catchment should be compared with actual business results.
Validation may include store visits, customer records, sales performance, competitor performance, existing store catchments, market benchmarks, and network overlap.
This helps show whether the catchment reflects real customer behavior.
Why Fixed-Radius Catchment Areas Can Be Misleading
A fixed-radius catchment draws a circle around a location, such as one, three, or five miles.
This method is easy to use, but it assumes that customers can travel equally in every direction.
In reality, movement is rarely that simple.
Fixed-radius analysis may fail to account for road connectivity, travel time, congestion, physical barriers, public transport, competitor locations, shopping destinations, and differences between urban and suburban markets.
For example, one customer may live three miles from a store and reach it in ten minutes. Another customer at the same distance may need thirty minutes because of poor road access.
Travel-time and mobility-based catchments often provide a more realistic view because they reflect accessibility and actual movement rather than distance alone.
How Catchment Area Analysis Supports Business Decisions
Site Selection
Catchment analysis helps businesses compare candidate sites based on demand, accessibility, population, competition, and customer movement.
A site may look attractive because of high population density. However, poor access or strong nearby competition may reduce its actual potential.
Store Network Planning
Catchment areas can help businesses find market coverage gaps, overlapping store areas, cannibalization risk, underserved neighborhoods, and expansion opportunities.
This supports better decisions about where to open, relocate, resize, or close locations.
Local Marketing
Catchment areas help marketers understand where customers are most likely to come from.
This can support local campaign targeting, direct mail, digital media, outdoor advertising, regional promotions, and store-level messaging.
Store Performance Analysis
Catchment analysis also helps businesses compare stores more fairly.
A high-performing urban store should not always be compared directly with a suburban or rural location.
Catchment context helps explain differences in demand, competition, customer profiles, and accessibility.
Data Used in Modern Catchment Area Analysis
| Data Type | What It Helps Reveal |
|---|---|
| Mobility data | Where visitors come from and how they move |
| Visit intelligence | When, how often, and how long locations are visited |
| Places data | Nearby competitors, brands, businesses, and demand generators |
| People data | Characteristics of the surrounding population |
| Market data | Broader commercial and economic potential |
Combining these datasets creates a more complete view than analyzing each one separately.
For example, population data may show strong demand in an area. Mobility data may then show that people usually travel toward a competing retail hub instead of the proposed site.
That difference can change the site decision.
How Factori Supports Catchment Area Analysis
Factori helps businesses analyze catchment areas using privacy-aware, aggregated real-world data.
Factori’s mobility data can help reveal movement patterns and visitor origins. Visit intelligence supports analysis of activity around stores and locations.
Places data adds context about nearby competitors, brands, and surrounding businesses. People and Market data add demographic and commercial context.
Businesses can use Factori’s datasets, APIs, and platform to support retail site selection, store network planning, trade area analysis, competitive benchmarking, market expansion, demand forecasting, and local campaign planning.
This helps teams move from static location assumptions to decisions based on real-world behavior.
Conclusion
A catchment area is more than a circle around a location.
It represents the real geographic market a business serves.
The strongest analysis combines accessibility, customer movement, visit behavior, competition, and local market context.
By using real-world data, businesses can build more accurate catchments and make better decisions about locations, store networks, marketing, and growth.
Frequently Asked Questions
What Is an Example of a Catchment Area?
A supermarket’s catchment area may include the nearby neighborhoods from which most customers travel to shop.
The size of the area depends on store format, competition, accessibility, and customer behavior.
What Determines the Size of a Catchment Area?
Catchment size is influenced by the type of business, customer demand, travel time, accessibility, competition, population density, store size, and the uniqueness of the products or services offered.
What Is the Difference Between a Catchment Area and a Trade Area?
The terms are often used interchangeably.
Both describe the geographic area from which a business attracts customers. Trade area is more common in retail, while catchment area is used across a wider range of industries.
How Often Should a Catchment Area Be Updated?
Catchment areas should be reviewed regularly, especially when customer behavior, transport access, competition, store networks, or local development changes.
High-growth markets may need more frequent updates.
Can Catchment Areas Overlap?
Yes. Catchment areas often overlap when several stores, branches, or competitors serve the same customers.
Studying this overlap can help businesses understand cannibalization risk, competitive pressure, and network coverage.