Retailers rarely operate in uniform markets. Stores differ by customer profile, local demand, competition, traffic patterns, product preferences, and purchasing behaviour.
Cluster analysis in retail industry helps businesses group similar stores, customers, products, or markets so they can make more relevant decisions across assortment planning, inventory, forecasting, marketing, and expansion.
The value of clustering does not come from creating groups alone. It comes from using the right data to build clusters that reflect real-world demand and support measurable business actions.
What Is Cluster Analysis in Retail Industry?
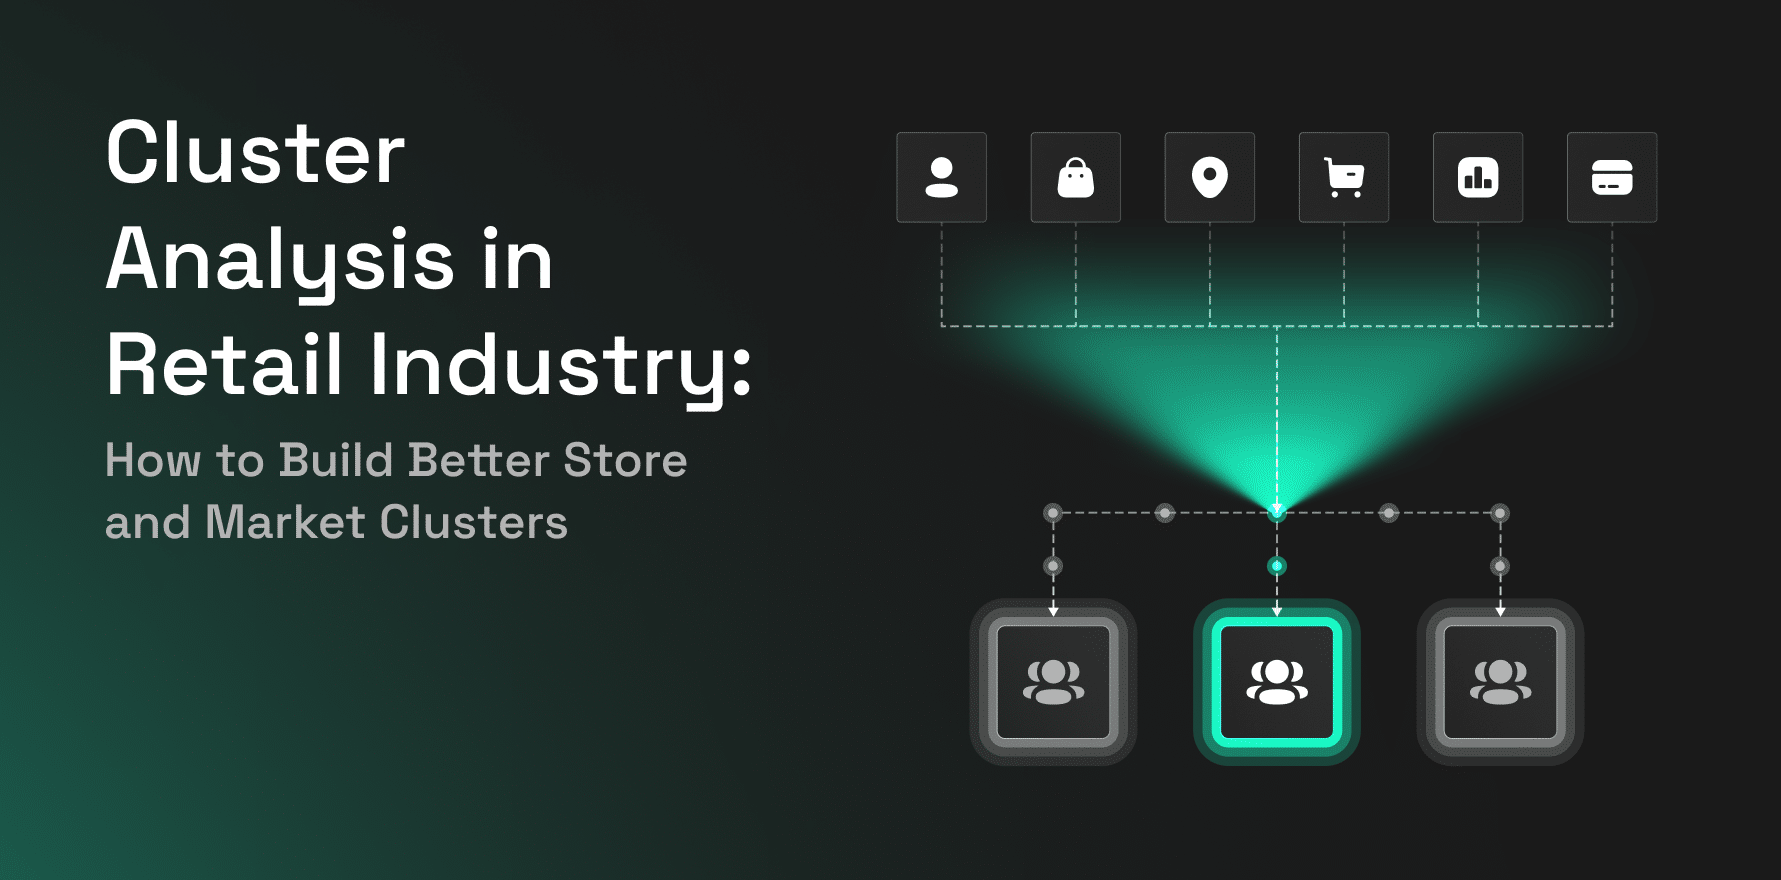
Cluster analysis in retail industry is a data analysis method used to group stores, customers, products, or markets based on shared characteristics and behavioural patterns.
Unlike manual segmentation, where groups are defined using predetermined rules, cluster analysis identifies similarities within the data. Retailers can then use these groups to apply different strategies across locations, customer segments, product ranges, or markets.
For example, a retailer may group stores based on:
- Sales performance
- Foot traffic
- Customer demographics
- Product demand
- Competitor density
- Store format
- Local market characteristics
This allows retail teams to move beyond broad regional planning and make decisions based on how each store or market actually behaves.
Where Retailers Use Cluster Analysis
Cluster analysis can support multiple retail decisions.
| Cluster type | Common data inputs | Business decision |
| Store clusters | Sales, foot traffic, format, catchment | Assortment and inventory planning |
| Market clusters | Population, competition, mobility, demand | Expansion and site selection |
| Customer clusters | Spend, frequency, visits, demographics | Targeting and retention |
| Product clusters | Demand, affinity, price, seasonality | Merchandising and promotions |
| Demand clusters | Sales patterns, visits, market signals | Forecasting and replenishment |
Retailers can use one or several cluster types depending on the business problem.
A merchandising team may focus on store and product clusters, while a strategy team may use market clusters to prioritize expansion opportunities.
Why Traditional Retail Clusters Often Fall Short
Many retailers already group stores by geography, store size, or revenue. These methods are easy to manage, but they often fail to capture meaningful differences in customer behaviour and local demand.
Common problems include:
- Grouping stores only by historical sales
- Using large geographic regions as a proxy for demand
- Relying on static demographic profiles
- Ignoring nearby competitors and complementary businesses
- Treating high foot traffic as equal to high purchase potential
- Failing to refresh clusters as market conditions change
- Creating clusters without linking them to business actions
Internal sales data can show what happened inside a store. It may not explain why performance differs across locations.
A high-performing store may benefit from stronger nearby demand, better access, lower competition, or a more valuable customer base. A weaker store may operate in a busy area but attract visitors who do not match the brand’s target audience.
Adding external market context helps retailers build clusters that are more actionable and commercially relevant.
What Data Should Retailers Use for Cluster Analysis?
The data selected for clustering should depend on the decision the retailer wants to improve.
| Data category | What it reveals | Example variables |
| Transaction data | Internal performance | Sales, basket size, category mix |
| Mobility data | Movement and visitation | Foot traffic, origins, dayparts |
| Visit intelligence | Store and competitor engagement | Visit frequency, repeat visits |
| Places data | Local commercial environment | Competitors, POI density, nearby brands |
| People and consumer data | Catchment characteristics | Demographics, interests, behaviours |
| Market data | Local opportunity | Market size, business density, demand |
Different use cases require different combinations of data.
For Assortment Planning
Retailers may use:
- Product-level sales
- Category demand
- Customer profiles
- Store visits
- Local lifestyle characteristics
This helps identify which products are most relevant for each store cluster.
For Site Selection
Useful inputs may include:
- Foot traffic
- Catchment population
- Competitor density
- Nearby POIs
- Customer demographics
- Visit patterns
- Market demand
These signals help retailers identify locations that resemble successful existing markets.
These signals help retailers identify locations that resemble successful existing markets. Read more.
For Demand Forecasting
Retailers can combine:
- Historical sales
- Store visits
- Product demand
- Local market characteristics
- Customer behaviour
- Competitive activity
This allows forecasting models to account for differences between store environments rather than applying one model across the network.
How to Build Actionable Retail Clusters
A strong retail clustering process starts with the business decision, not the algorithm.
1. Define the Decision
Identify the problem the clusters should solve.
Examples include:
- Improving local assortments
- Allocating inventory
- Prioritizing expansion markets
- Forecasting demand
- Comparing store performance
- Planning local campaigns
A clear objective prevents the analysis from producing clusters that are statistically interesting but commercially irrelevant.
2. Select What You Want to Cluster
Retailers can cluster:
- Stores
- Customers
- Products
- Markets
- Trade areas
- Demand patterns
The unit of analysis should match the decision. Store clustering is appropriate for assortment planning, while market clustering is more useful for expansion.
3. Combine Internal and External Data
Internal data provides performance history. External data adds context about the surrounding market.
Combining both can reveal why stores with similar sales may have different growth potential or why nearby locations should not always be grouped together.
4. Standardize the Variables
Variables may use different scales. Sales may be measured in millions, while competitor count may be a single-digit number.
Retailers should normalize variables so one metric does not dominate the clustering model simply because it has larger values.
5. Test and Validate the Clusters
Useful clusters should be:
- Distinct from one another
- Stable enough for planning
- Easy for business teams to understand
- Large enough to manage
- Connected to meaningful performance differences
A model that produces ten clusters may be statistically strong but difficult to operationalize.
6. Connect Every Cluster to an Action
Each cluster should have a defined strategy, owner, and KPI.
Actions may include:
- Adjusting product assortment
- Changing inventory thresholds
- Creating local campaign plans
- Applying different store benchmarks
- Prioritizing specific markets
- Building separate demand forecasts
Without action, clustering remains an analytical exercise rather than a business tool.
Example of Cluster Analysis in Retail
Consider a retailer with 250 stores across several markets.
The retailer combines:
- Sales per square foot
- Foot traffic
- Visit frequency
- Customer demographics
- Competitor density
- Local category demand
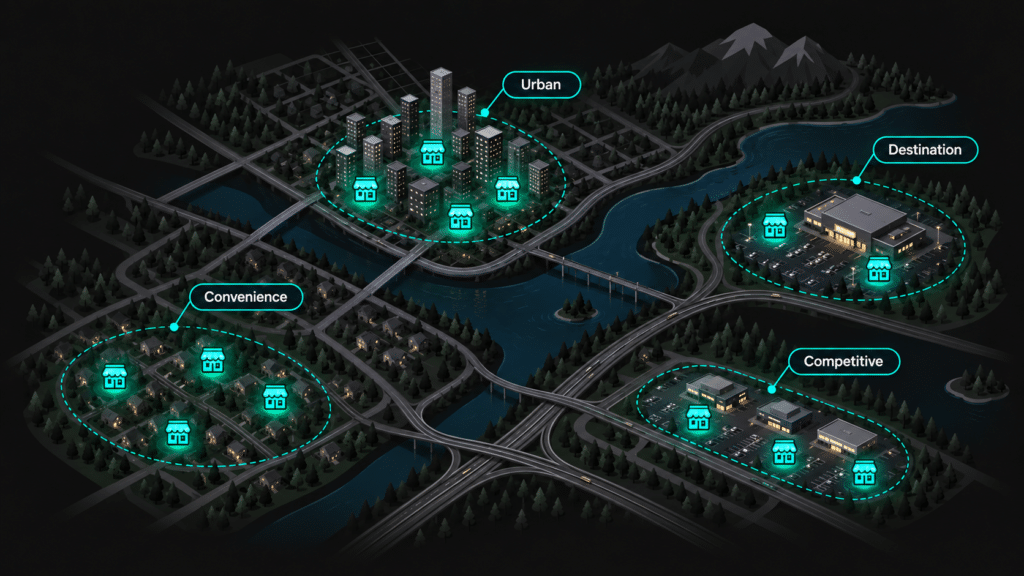
The analysis identifies four store clusters.
| Store cluster | Main characteristics | Potential action |
| High-traffic urban stores | Dense markets, frequent visits, high competition | Optimize fast-moving assortments |
| Affluent destination stores | Higher-value customers, longer travel distances | Expand premium product ranges |
| Convenience-led local stores | Frequent nearby visits, smaller baskets | Improve replenishment and essentials |
| Low-conversion competitive stores | Strong traffic, weak sales, high competition | Review pricing, format, and positioning |
The retailer can now compare stores against relevant peers rather than using one benchmark for the entire network.
It can also apply different assortments, inventory plans, marketing strategies, and forecasts to each cluster.
How to Evaluate Data for Retail Clustering
Retail clustering is only as reliable as the data behind it.
When evaluating an external data provider, retailers should consider:
- Coverage: Does the data cover all relevant stores and markets?
- Granularity: Can it support store, neighbourhood, and trade-area analysis?
- Freshness: Is the data updated frequently enough to reflect changing behaviour?
- Consistency: Are attributes standardized across markets?
- Joinability: Can the data connect with store coordinates, polygons, IDs, or first-party records?
- Privacy: Is the data aggregated and designed for responsible analysis?
- Accessibility: Can teams access it through APIs, cloud environments, or bulk delivery?
Retailers should also confirm that the data can be integrated into existing analytics, forecasting, and planning workflows.
How Factori Supports Retail Cluster Analysis
Factori helps retailers enrich internal sales and store data with real-world intelligence about movement, visits, places, people, consumers, and markets.
Retail teams can use Factori to:
- Compare store and trade-area characteristics
- Analyze foot traffic and visitation patterns
- Measure competitor and POI density
- Enrich catchments with audience and consumer attributes
- Add market context to site-selection models
- Improve inputs for demand forecasting and assortment planning
Factori datasets, APIs, and platform workflows help businesses move from raw external data to model-ready insights for retail planning and decision-making.
Conclusion
Cluster analysis helps retailers turn complex data into meaningful groups that support more precise decisions.
The strongest retail clusters combine internal performance data with external signals that explain customer behaviour, local demand, competition, and market conditions.
When each cluster is linked to a clear action and KPI, retailers can improve assortment planning, inventory allocation, forecasting, marketing, site selection, and expansion.
Frequently Asked Questions
What Is Store Clustering in Retail?
Store clustering groups retail locations with similar sales, customer, format, demand, or market characteristics. Retailers use these groups to improve assortment, inventory, benchmarking, and forecasting.
What Variables Are Best for Retail Cluster Analysis?
The best variables depend on the business goal. Common inputs include sales, foot traffic, product mix, customer demographics, visit behaviour, competitor density, and local demand.
How Is Cluster Analysis Different From Store Grading?
Store grading usually ranks locations based on performance, size, or revenue. Cluster analysis groups stores using multiple shared characteristics, including customer, demand, and market variables.
How Often Should Retail Clusters Be Updated?
Retail clusters should be reviewed when store performance, customer behaviour, competition, or market conditions change materially. Retailers operating in fast-changing categories may need more frequent updates.