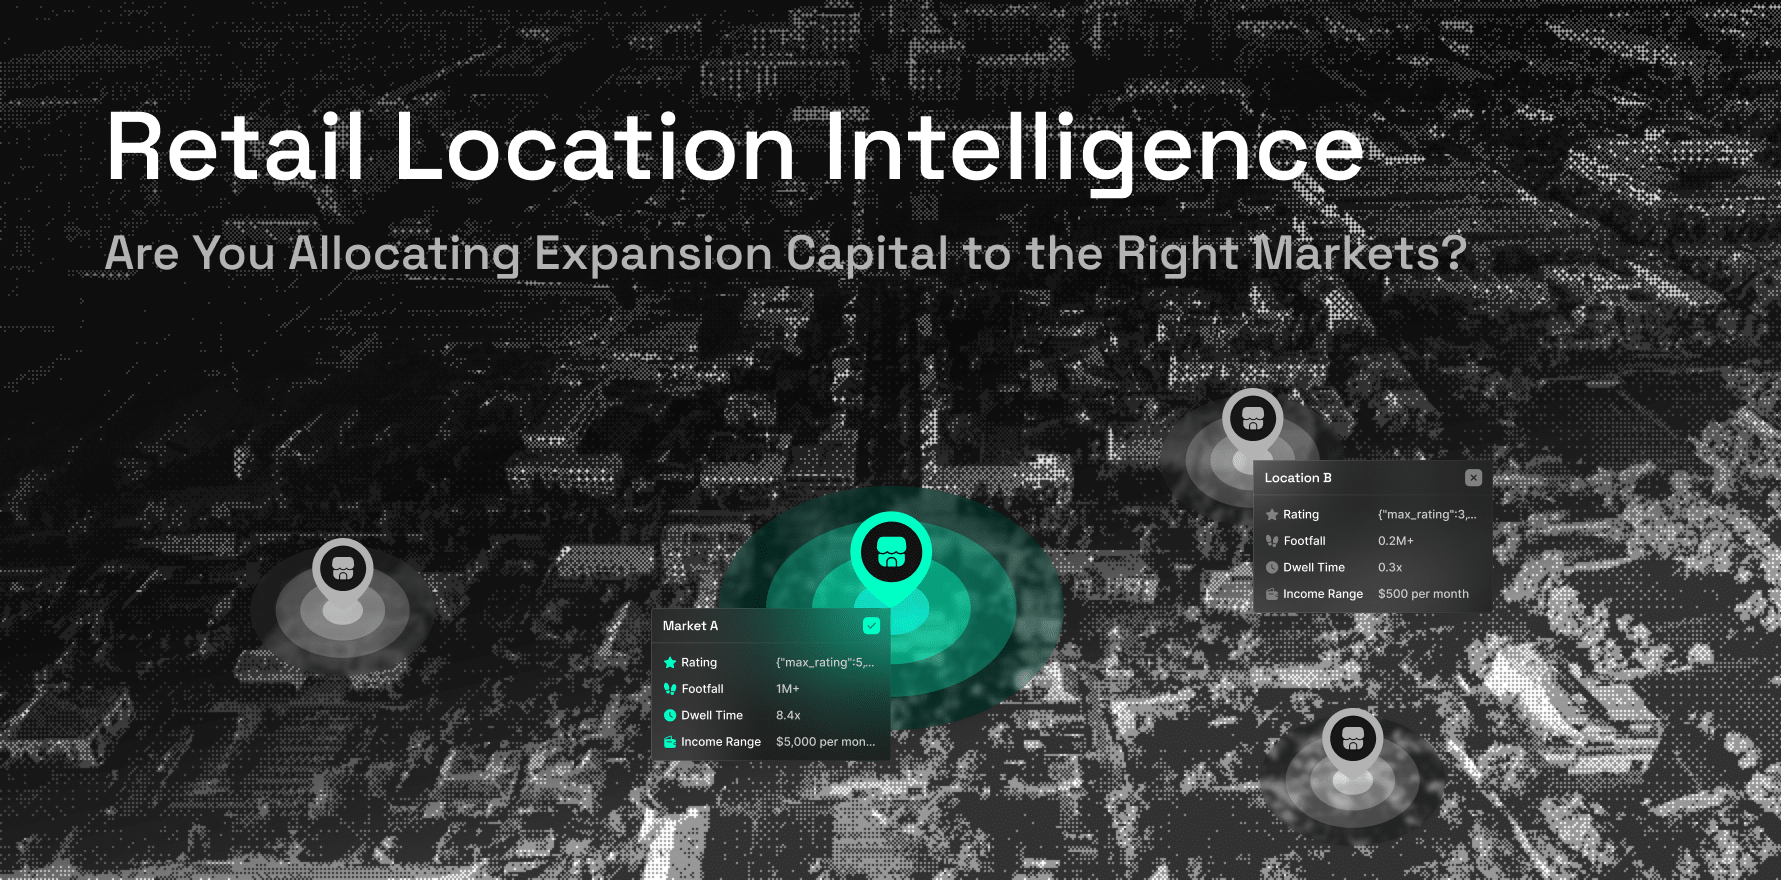
Retail location intelligence combines store performance, customer behavior, market conditions, and spatial data to help retailers decide where physical expansion capital should go.
For a retailer planning dozens or hundreds of locations, the question is not simply whether a market looks attractive. The harder question is whether another store can capture enough incremental demand to justify the capital without weakening the existing network.
That requires moving beyond maps and demographics toward four questions:
Is the market attractive?
Can the site capture that demand?
Is the demand incremental to the network?
Does the opportunity justify the capital required?
- Retail location intelligence should help retailers allocate expansion capital, not simply identify attractive locations.
- Market size is not the same as reachable demand because customer behavior, accessibility, competition, and trade areas affect what a store can realistically capture.
- A strong site does not automatically create network growth if a meaningful share of its sales comes from existing stores.
- Market, customer, mobility, competitor, and spatial signals become useful when they can be connected to store economics and performance.
- Markets should be normalized before comparison so larger populations or higher raw traffic do not automatically appear more attractive.
- Location scores should explain the investment thesis rather than hide demand, competition, accessibility, and network effects behind one number.
- Holdout and forward validation provide stronger evidence than simply fitting a location model to existing stores.
- Every new store should create a feedback loop where actual trade areas, sales, traffic, and cannibalization improve the next expansion decision.
Evaluate Markets Through Four Decision Gates
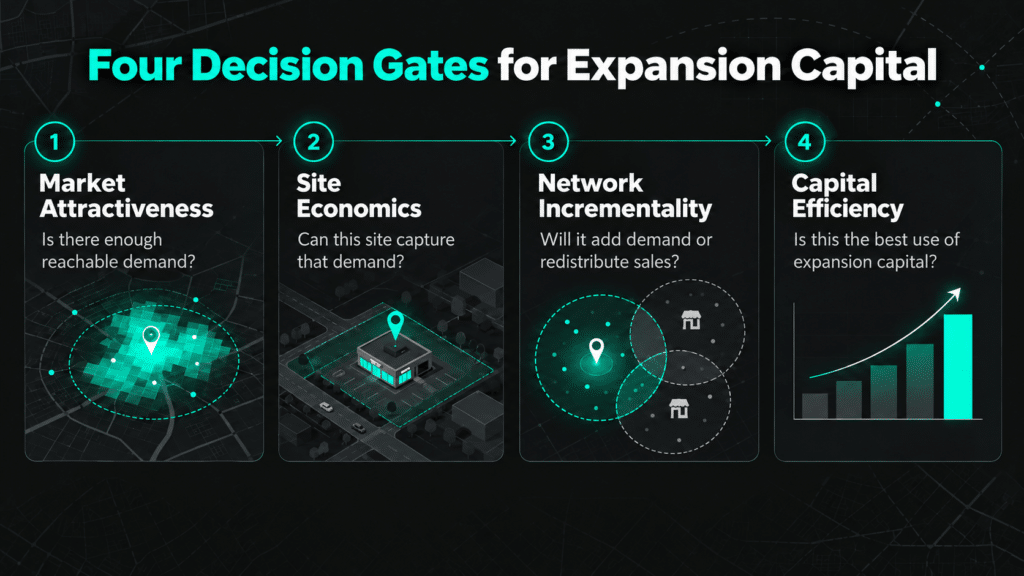
A useful location intelligence process should progressively reduce uncertainty.
| Decision gate | What the retailer needs to know |
| Market attractiveness | Is there enough reachable and relevant demand? |
| Site economics | Can this location capture enough of that demand? |
| Network incrementality | Will the store add demand or redistribute existing sales? |
| Capital efficiency | Is this the best use of expansion capital compared with other opportunities? |
This distinction matters because a location can perform well on one dimension and poorly on another.
A large market does not automatically produce a strong site. A strong site does not automatically improve the network. And a profitable store is not automatically the best use of limited expansion capital.
Market Size Is Not the Same as Reachable Demand
Population, income, and category spending are useful starting points, but they describe the market around a site rather than the portion a store can realistically capture.
Retailers need to narrow the analysis from:
Total market demand
to:
Reachable demand
to:
Demand the brand can realistically capture
A market may contain 300,000 consumers, but highways, competitors, shopping patterns, store coverage, or travel behavior may reduce the effective opportunity.
This is why the geographic definition matters.
A retailer might use:
- ZIP codes
- fixed-radius rings
- drive-time areas
- customer-origin trade areas
- mobility-derived catchments
Each produces a different market profile.
A five-mile radius can include neighborhoods customers rarely travel between. A destination retailer may attract visitors from much farther away than a conventional drive-time model assumes.
Trade area analysis becomes more useful when catchments reflect observed customer behavior instead of an arbitrary distance.
Retail location intelligence platforms increasingly combine movement patterns, demand, competition, and trade-area analysis rather than relying on demographics alone.
Connect Location Signals to Store Economics
External data matters only when it helps explain or predict a commercial outcome.
A retailer typically needs four groups of inputs.
Internal Performance
- Store sales
- Transactions
- Basket size
- Store format
- Floor area
- Profitability
- Operating hours
Customer Signals
- Customer origins
- Loyalty data
- Visit frequency
- Audience characteristics
- Digital or CRM behavior
Market Signals
- Foot traffic
- Mobility
- Competitors
- POIs
- Events
- Demographics
- Economic conditions
Spatial Signals
- Accessibility
- Roads
- Drive times
- Physical barriers
- Trade areas
The objective is not to accumulate more layers.
It is to identify which variables consistently separate stronger stores from weaker stores and stronger markets from weaker markets.
For example, raw foot traffic may correlate poorly with sales if much of the traffic is transit activity. A smaller volume of visitors from the retailer’s target catchment may be more predictive.
Foot traffic analytics can help distinguish raw movement volume from patterns that are actually relevant to store performance.
Location intelligence becomes decision-grade when external market signals can be connected back to revenue, transactions, profitability, or another store-level outcome.
Evaluate Network Incrementality Before Store Potential
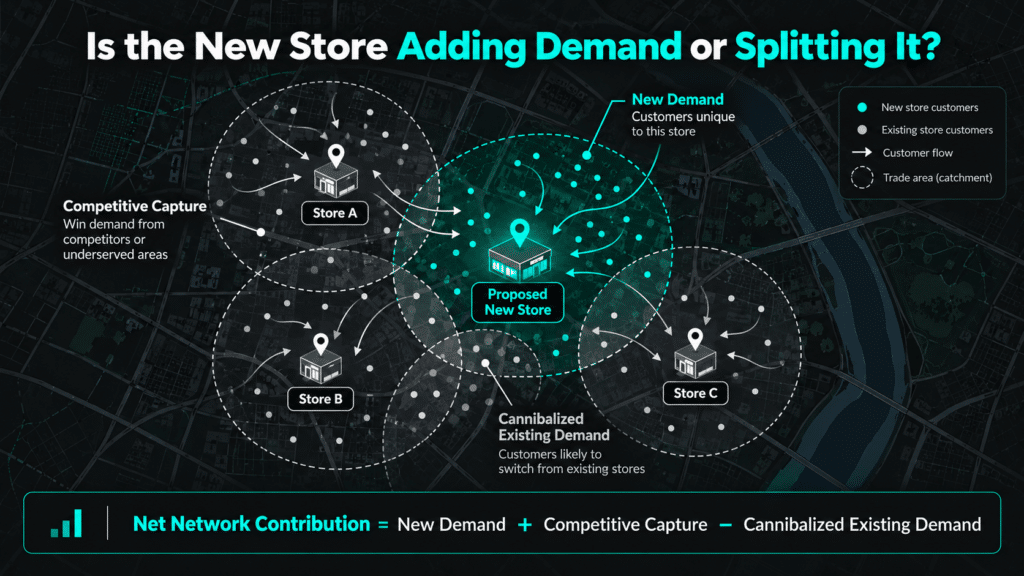
This is where site selection becomes network strategy.
Suppose a proposed location is forecast to generate:
$5 million in annual sales
But analysis suggests:
$1.4 million may shift from existing stores.
The investment should not be evaluated as though it created $5 million of new network demand.
A useful conceptual framework is:
Net Network Contribution = New Demand + Competitive Capture − Cannibalized Existing Demand
This is not a standardized financial formula. It is a way to separate gross site potential from incremental network value.
Retailers should examine:
- customer-origin overlap
- trade-area overlap
- cross-visitation
- distance decay
- existing store coverage
- competitive capture
- market saturation
Retail store cannibalization should therefore be analyzed before the new-store forecast is treated as incremental growth.
The same principle applies to retail clustering. Nearby stores can strengthen a destination when they create choice and cross-shopping, or weaken economics when too many locations compete for the same customer pool.
Retail network-planning systems increasingly evaluate site potential and cannibalization together rather than treating locations independently.
The retailer should not ask only:
“Will this store perform?”
It should also ask:
“What happens to the rest of the network if we open it?”
Normalize Markets Before Comparing Them
Raw numbers can make large markets look automatically superior.
Consider two candidate markets:
Market A: 1 million monthly visits
Market B: 500,000 monthly visits
Market A appears stronger.
But that conclusion may change after accounting for population, number of competitors, number of existing stores, and category demand.
More comparable measures might include:
- visits relative to population
- demand per existing store
- competitors per reachable customer
- category share of visits
- trade-area penetration
- customer overlap
- growth relative to local baseline
The goal is not to ask:
Which market is bigger?
It is:
Which market offers more opportunity relative to the demand and competition already present?
That distinction matters when capital is being allocated across markets with very different scale.
Separate Market Potential From Store Execution
An underperforming store does not automatically indicate a weak market.
Conceptually, observed performance is influenced by three different factors:
Store Performance = Market Potential × Site Capture × Store Execution
A retailer may have:
Strong market + weak site
The market has demand, but the store has poor accessibility or visibility.
Strong site + weak market
The location is good, but there is not enough underlying demand.
Strong market + strong site + weak execution
Local demand exists, but inventory, service, assortment, or operations are limiting performance.
Location intelligence should help separate these conditions before a retailer decides to close, relocate, remodel, or add another store.
Otherwise, the business can mistake an execution problem for a market problem or a structural market problem for something operations can fix.
A Site Score Should Explain the Investment Thesis
Scoring can help expansion teams compare hundreds of opportunities consistently.
But:
Site A: 86
and
Site B: 74
is not enough.
Decision-makers need to know what produced the difference.
An explainable score might separate:
- reachable demand
- customer fit
- accessibility
- competition
- co-tenancy
- foot traffic
- network overlap
- expected economics
Weights should also differ where business models differ.
The factors that predict performance for a grocery store may not carry the same importance for QSR, luxury retail, pharmacy, or destination big-box.
For analytics teams, explainability also creates a feedback loop. If a supposedly important feature repeatedly fails to predict performance, its weight or role can be reconsidered.
A location score should summarize the investment thesis, not replace it.
Validate the Model Before Trusting the Ranking
One of the biggest mistakes in location modeling is evaluating a model only on stores it already knows.
A stronger validation process has three stages.
1. Existing-Store Fit
Can the model explain historical store performance?
Useful, but insufficient.
2. Holdout Validation
Can the model predict stores that were deliberately excluded from training?
This tests whether the relationships generalize.
3. Forward Validation
Can the model score an unopened site and later predict its actual performance?
This is the strongest test because it mirrors the investment decision itself.
The dataset should also retain weaker openings, closed stores, relocations, and failed sites where possible. Training only on the current successful estate can create an overly optimistic picture of what predicts performance.
For senior decision-makers, the relevant question is not:
“How accurate is the model on our current stores?”
It is:
“How well does it predict decisions we have not made yet?”
Every New Store Should Improve the Next Investment
Location intelligence should not stop when the store opens.
Compare what was predicted with what actually happened:
Predicted trade area → Actual customer origins
Expected foot traffic → Observed traffic
Expected customer profile → Observed audience
Expected cannibalization → Actual store overlap
Forecast sales → Actual sales
The result is a learning loop:
Predict → Invest → Measure → Recalibrate
Post-opening monitoring can turn actual store behavior into evidence for improving future site-selection assumptions.
Over time, the retailer builds something more valuable than a collection of maps: a proprietary understanding of what makes its own formats work.
How Factori Supports Retail Location Intelligence
Factori provides real-world datasets across Mobility, Places, People, Events, Market, Economic, Property, Business, and related domains that retail teams can combine with internal store and customer data.
Teams can use these signals to evaluate trade areas, market demand, competitors, visitor behavior, customer origins, cannibalization, and expansion opportunities, either through analytical workflows or within their own BI, warehouse, and modeling environments.
The value of any signal should ultimately be tested against the retailer’s own store performance and investment decisions.
Before You Allocate the Next Dollar of Expansion Capital
Retail location intelligence should make capital allocation easier to explain and defend.
Before approving another market or store, ask:
- Demand: Are we measuring reachable demand or simply market size?
- Capture: What gives this site the ability to win that demand?
- Competition: Are competitors targeting the same customers?
- Network: How much demand will actually be incremental?
- Economics: Does the opportunity justify the investment?
- Comparison: Are markets normalized enough to compare fairly?
- Model: Can the recommendation be explained?
- Validation: Has the model predicted unseen or future stores?
- Learning: Will the outcome improve the next expansion decision?
The goal is not to identify the location with the most favorable data points.
It is to determine where the next dollar of expansion capital can create the greatest incremental network value.
FAQs
What is retail location intelligence?
Retail location intelligence combines geographic, customer, mobility, competitor, market, and internal store data to support decisions about store expansion, site selection, market entry, relocation, closure, and network planning.
What data is used in retail location intelligence?
Retailers can combine store sales, transactions, customer data, demographics, mobility, foot traffic, POIs, competitors, trade areas, accessibility, events, and economic signals.
How does retail location intelligence help expansion teams?
It helps teams estimate reachable demand, compare markets, understand competitors, identify trade areas, evaluate candidate sites, model cannibalization, and estimate the incremental effect of a new store on the existing network.
How is retail location intelligence different from retail location analysis?
Retail location analysis may evaluate an individual site or market, while location intelligence can provide a repeatable system for comparing opportunities, modeling network effects, validating forecasts, and allocating expansion capital across the portfolio.
How should retailers validate a location intelligence model?
Retailers should test whether the model explains existing stores, predicts held-out stores, and most importantly, whether pre-opening forecasts match actual performance after new locations open.
Meta Title
Retail Location Intelligence: Improve Expansion Decisions
Meta Description
Use retail location intelligence to compare reachable demand, network incrementality, site economics, and market potential before committing expansion capital.