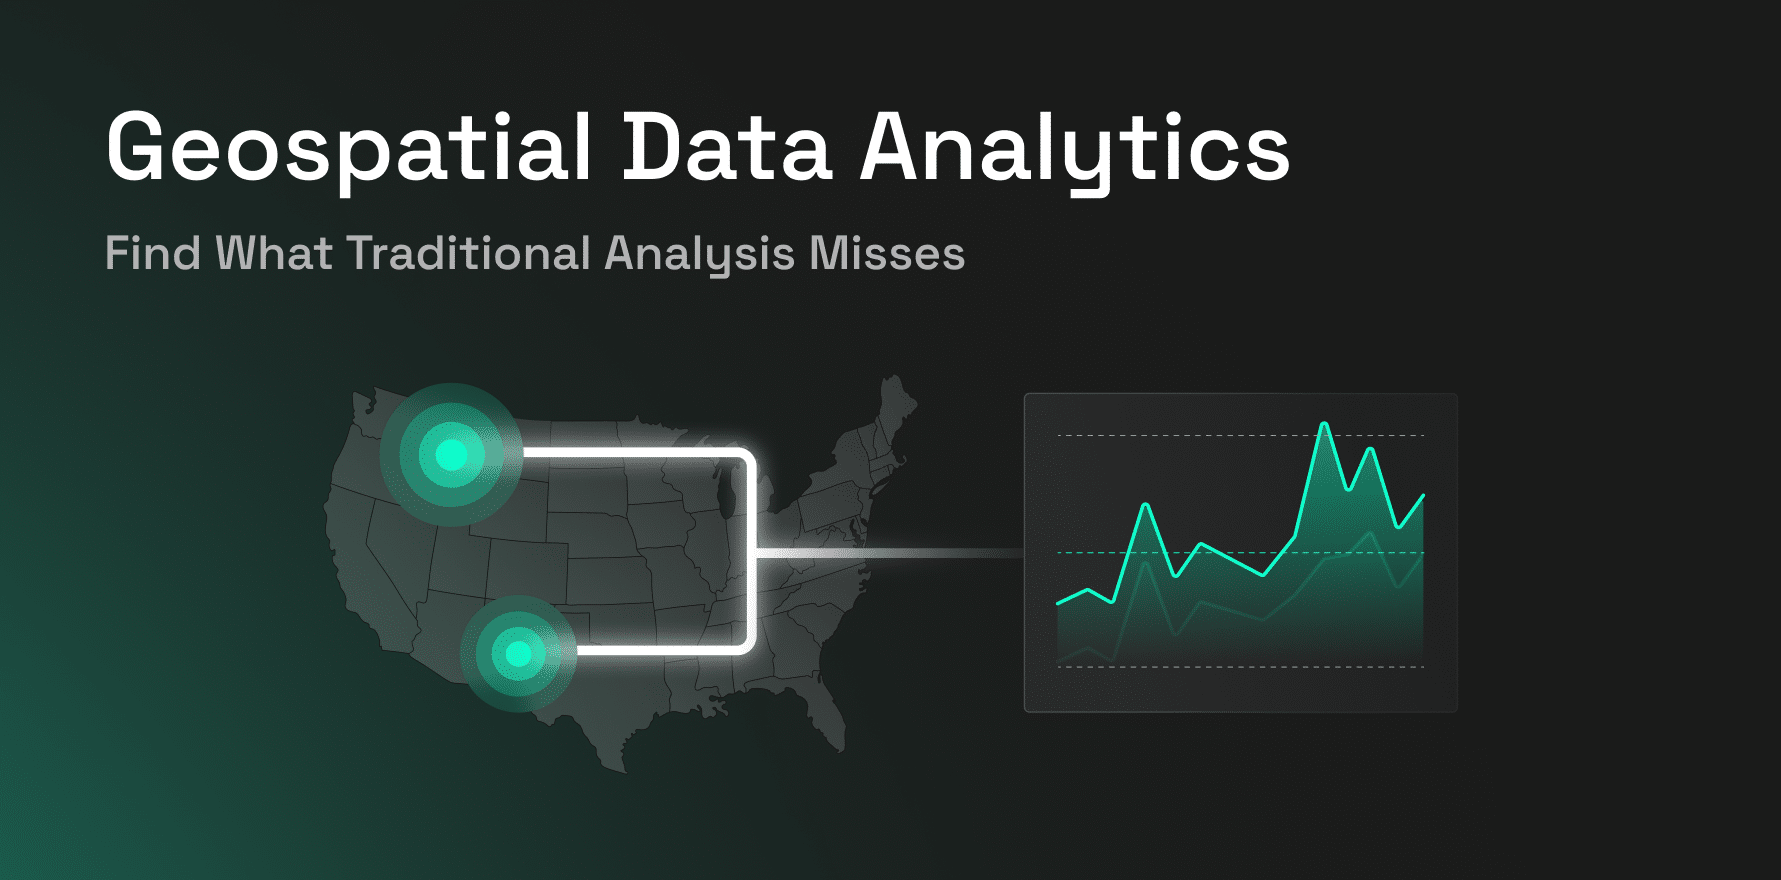
Traditional analytics can show which stores are growing, which markets contain the most customers, or which assets carry the highest risk. But when geography is treated only as a ZIP code, city, region, or coordinate, the analysis can miss the spatial relationships explaining why those numbers differ.
Geospatial data analytics measures relationships such as distance, proximity, containment, overlap, accessibility, and movement, then brings them into business analysis and predictive models. Its value is not the map itself. It is whether spatial context changes the conclusion. For the underlying concepts, see Factori’s geospatial data guide and its overview of geo and spatial data concepts.
Key Takeaway
- Geospatial data analytics adds spatial relationships such as proximity, accessibility, overlap, movement, and geographic context to traditional analysis.
- Location data should be evaluated based on whether it is observed, estimated, modeled, or indexed before it influences a model or decision.
- Spatial features such as drive time, competitor density, trade-area overlap, POI mix, and visitor origins can reveal patterns that aggregate market data misses.
- Geographic scale matters because changing boundaries or aggregation levels can materially change the patterns visible in the data.
- Spatially enriched models should be tested against non-spatial baselines and validated on geographically separate or unseen markets.
- The value of geospatial analytics should be measured through predictive lift, decision lift, and business lift, not model accuracy alone.
- Geospatial analytics creates the most value when spatial context becomes part of a repeatable data workflow and materially changes a business recommendation.
Traditional Analysis Can See the Number but Miss the Geography
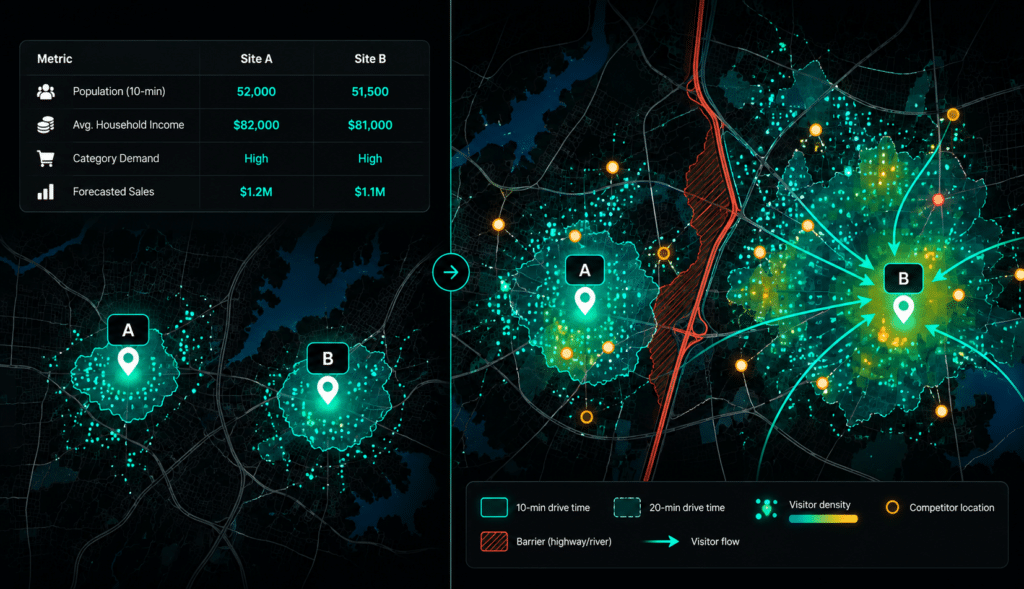
Imagine two candidate retail sites with similar population, household income, category demand, rent, and historical sales from comparable stores. A conventional scoring model may rank them almost equally.
Add spatial context and the picture can change. Site A may sit close to demand but behind a highway barrier. Site B may have fewer nearby residents but better drive-time access, stronger visitor inflows, fewer competitors inside its actual catchment, and less overlap with existing stores.
Traditional analysis can contain geographic fields and still miss these relationships. The issue is not tables versus maps. It is whether geography is represented as something that can be measured.
Important spatial relationships include:
- Proximity: How close are customers, competitors, assets, or events?
- Accessibility: Can people realistically reach the location given roads, travel time, barriers, or transit?
- Containment and overlap: Which customers, competitors, stores, or risks fall inside the same area?
- Movement: Where does demand originate, where does it travel, and how does that pattern change?
- Geographic scale: Does the pattern change across ZIP codes, census tracts, grids, H3 cells, or custom trade areas?
This is why trade area analysis can reveal more than a fixed radius. Actual catchments can be shaped by accessibility, customer movement, competing destinations, and physical barriers.
Geographic scale can also change the analytical result. The modifiable areal unit problem, or MAUP, describes how the same underlying observations can produce different patterns when the scale or shape of geographic aggregation changes.
Know What Kind of Spatial Signal You Are Using
More spatial data does not automatically create better analysis. Teams need to understand what each input actually represents before it enters a model or decision process.
| Signal type | What it represents | Example |
| Observed | Recorded event or location | Store coordinate or recorded location event |
| Estimated | Quantity inferred from samples or other inputs | Estimated visitation or population |
| Modeled | Output produced by an analytical model | Demand forecast or propensity score |
| Indexed | Relative strength compared with a benchmark | Activity index where 100 is the baseline |
These signals are not interchangeable.
Observed data can still contain measurement or attribution error. Estimates depend on sampling and methodology. Modeled outputs depend on their features and assumptions, while indexes communicate relative strength rather than absolute volume.
For analytics and data-science teams, that distinction affects how much weight a feature should receive and how confidently its output should be presented.
Turn Geography Into Features, Not Just Maps
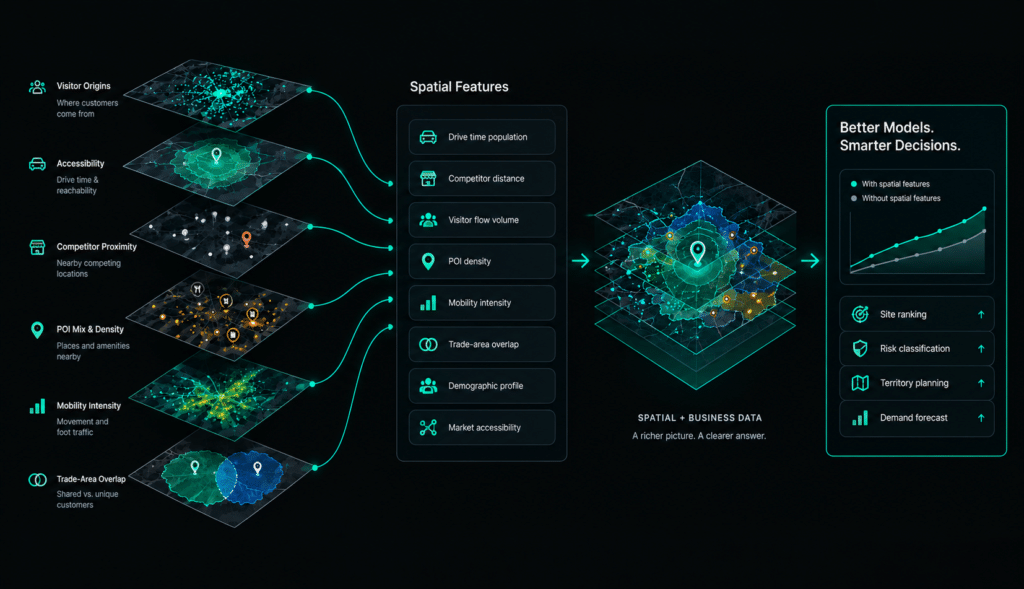
A map visualizes location. Geospatial analytics becomes more valuable when spatial relationships become measurable features that can be joined to business data.
| Business question | Spatial feature |
| Can customers realistically reach this site? | Drive time or accessibility |
| How concentrated is competition? | Competitor density |
| Will two stores serve the same customers? | Trade-area overlap |
| Where does demand originate? | Origin-destination flows |
| What surrounds the location? | POI mix and proximity |
| How active is the market? | Mobility or visitation intensity |
Consider a store-performance model based on population, income, store size, rent, and historical sales. A spatially enriched version could add competitor distance, drive-time population, visitor origins, trade-area overlap, mobility intensity, and surrounding place mix.
POI data can structure nearby businesses and competitive context, while foot traffic analytics can show how activity around a location changes across days, periods, or markets.
The objective is not to maximize the number of spatial features. It is to identify features that explain something the existing analysis misses. That is where location intelligence becomes useful: geographic context is connected to business performance instead of remaining a separate map layer.
Validate Spatial Lift, Not Just Model Accuracy
Spatial data creates a validation problem because nearby observations are often related. Stores on the same corridor may share customers and competitors, while neighboring areas may have similar demographics and movement patterns.
This is known as spatial autocorrelation, which describes a relationship between feature values and where those features are located.
That matters when training predictive models. If geographically similar observations appear in both training and validation sets, a random split can sometimes make model performance look stronger than it will be in a genuinely different geography.
A stronger evaluation compares a non-spatial baseline with a spatially enriched model and then tests both across geographically separated or previously unseen markets.
The evaluation should happen at three levels:
Predictive lift: Does spatial context improve out-of-sample prediction?
Decision lift: Does it change the site ranking, risk classification, territory, forecast, or recommendation?
Business lift: When the changed recommendation is implemented, does the business outcome improve?
This distinction matters. A spatial feature can improve model accuracy slightly without changing a single business decision. In that case, the additional analytical and engineering complexity may have little practical value.
Make Geospatial Analytics Part of the Data Stack
Geospatial analysis has traditionally been separated from broader enterprise analytics. Data moved into specialist GIS tools, spatial work happened there, and results were exported back into BI or modeling environments.
Modern data platforms increasingly support spatial operations closer to where enterprise data already lives. BigQuery geospatial analytics, for example, supports geographic data types and functions for operations such as distance, containment, intersection, and other spatial relationships.
For data engineering teams, the requirement is repeatability. Spatial pipelines need controlled geographic resolution, refresh schedules, lineage, permissions, warehouse access, and model integration so the same analytical logic can run across customers, stores, transactions, assets, and markets.
The goal is not another one-off map. It is a reusable analytical capability.
Turn Spatial Context Into a Better Decision
A strong geospatial workflow begins with the business object being analyzed, such as a customer, store, asset, transaction, event, or market.
Teams then identify the geographic relationship that matters. That might be accessibility for a proposed store, competitor proximity for an existing location, overlap between trade areas, or movement between customer origins and destinations.
Relevant context can then be added around that geography, including places, population, competition, mobility, and audience behavior. Those spatial variables are tested to determine whether they improve the analysis and whether that improvement changes the recommended action.
For retailers, this can change which site or market receives expansion capital. Retail location analysis becomes more useful when movement, competition, trade areas, surrounding businesses, and local demand are evaluated alongside the economics of each candidate.
For financial institutions, spatial context may change branch or ATM planning. Logistics teams may reconsider facility locations based on network accessibility, while media teams may shift spend based on audience concentration and real-world movement.
Geospatial analytics creates value when location moves from being a descriptive context to changing the recommendation.
How Factori Supports Geospatial Data Analytics
Factori provides real-world datasets covering places, mobility, people, audiences, and other market contexts that can be connected with internal store, customer, transaction, asset, or market data.
These signals can be converted into spatial features and compared with an existing analytical baseline. Analysts and data scientists can then test whether real-world context improves prediction, changes a recommendation, or produces a stronger business outcome.
The goal is not to add more layers to a map. It is to provide spatial evidence that can be tested against the decisions the organization is trying to improve.
Conclusion
Traditional analysis is strong at comparing attributes. Geospatial data analytics becomes valuable when relationships between those attributes and geography affect the answer.
Teams should understand whether each spatial input is observed, estimated, modeled, or indexed, then test whether it improves prediction, changes a recommendation, and ultimately improves the business outcome.
If spatial context does not change the model, decision, or result, additional geospatial complexity may not be necessary. If it does, location has become a meaningful analytical variable rather than simply another field in a dataset.
FAQs
What does geospatial data analytics reveal that traditional analytics can miss?
It can reveal proximity, accessibility, overlap, containment, movement, concentration, and geographic dependence that disappear when location is treated only as a category, coordinate, or administrative boundary.
How do you know whether spatial features improve a predictive model?
Compare a non-spatial baseline with a spatially enriched model and validate both on geographically separated or unseen locations. Then determine whether the improvement also changes the recommendation and business outcome.
Why can geographic boundaries change analytical results?
Aggregating the same observations into different geographic units can produce different patterns. Geographic resolution should therefore follow the business question rather than defaulting to whichever ZIP code, county, or administrative boundary is easiest to obtain.