Retail location decisions depend on more than rent, population, and nearby competitors.
Retailers also need to understand where customers move, which areas generate demand, how stores interact, and whether a market can support more locations.
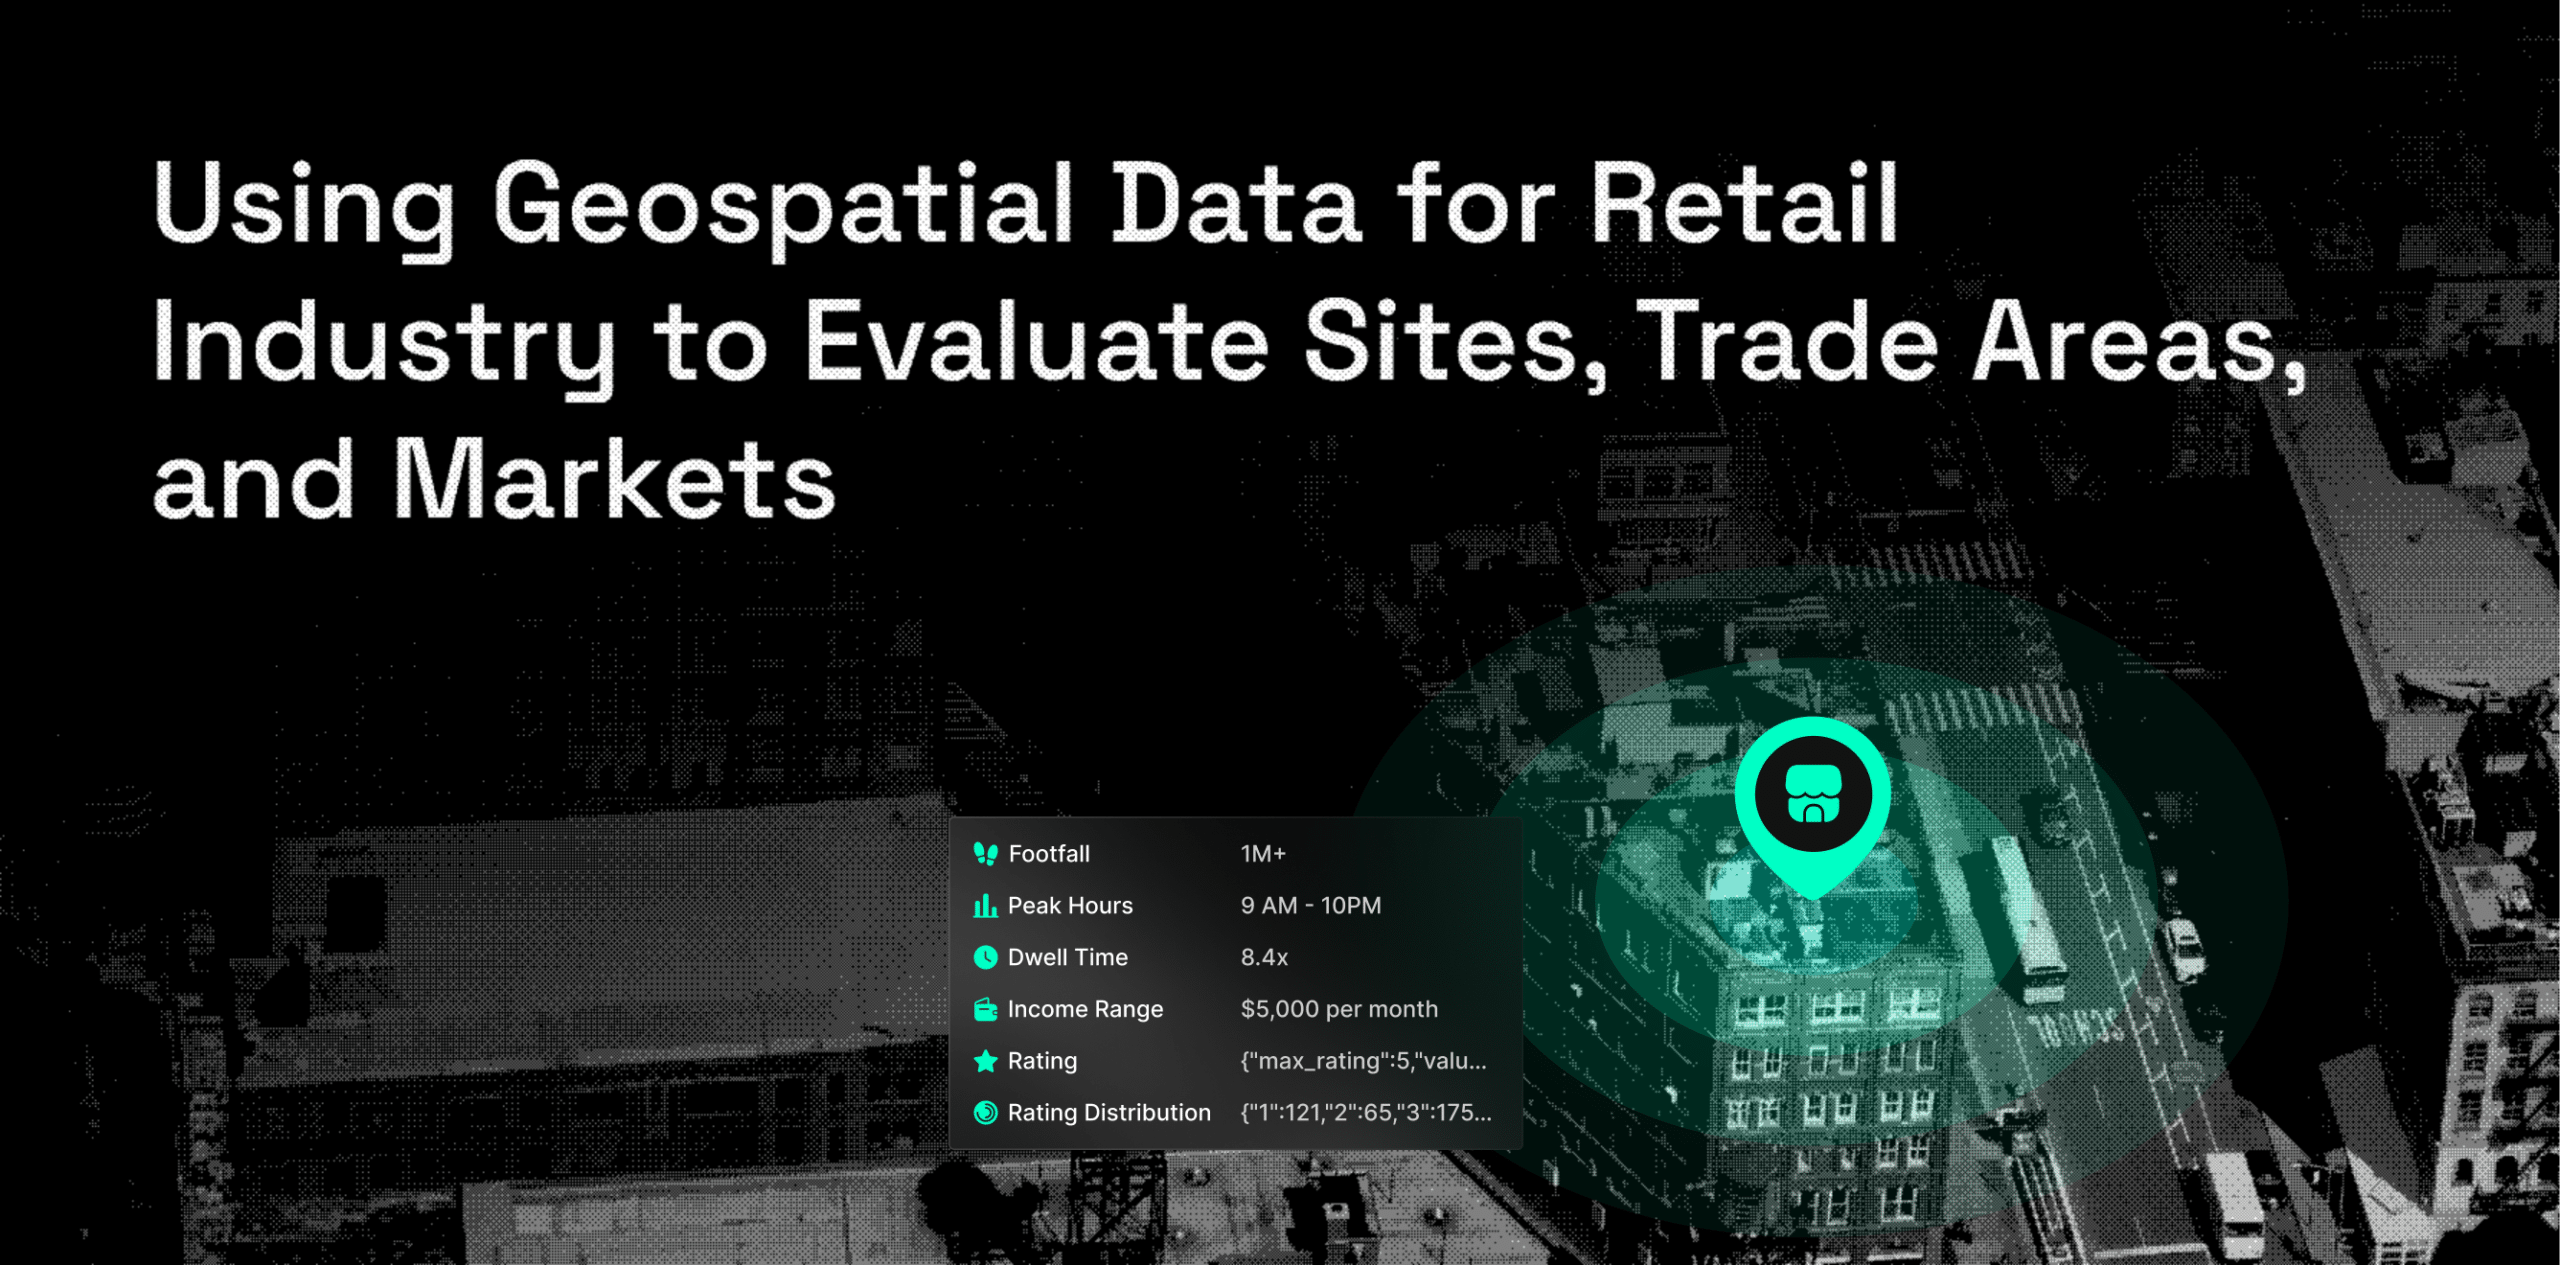
Using geospatial data for retail industry analysis connects store performance with real-world location signals. By combining mobility, Places, visit, people, market, and internal business data, retailers can compare sites, define trade areas, assess markets, and reduce investment risk.
What Geospatial Data Do Retailers Need?
No single dataset can show whether a retail location will succeed.
A strong retail industry analysis combines internal store performance with external data about people, movement, places, and local markets.
| Dataset | What It Reveals | Retail Application |
|---|---|---|
| Places and POI data | Competitors, nearby businesses, shopping centers, amenities, and retail clusters | Site and competitor analysis |
| Mobility data | Movement volumes, travel patterns, and activity around locations | Demand and accessibility analysis |
| Visit intelligence | Visit frequency, dwell time, repeat visits, and daypart patterns | Store and competitor benchmarking |
| People data | Demographic, household, lifestyle, and behavioral characteristics | Customer-market fit |
| Market and economic data | Commercial activity, spending potential, and local conditions | Market prioritization |
| Internal retail data | Sales, inventory, transactions, profitability, and store performance | Performance validation |
The strongest insights come from joining external location signals with internal business results.
Sales data may show that a store is underperforming. Mobility data and visit intelligence can help explain whether the cause is weak demand, poor access, heavy competition, or store execution.
How Geospatial Data Helps Retailers Evaluate Sites
Site evaluation focuses on a specific property or proposed store location.
Retailers need to know whether the surrounding area can support the expected sales, traffic, and customer profile.
Retail mapping brings several location signals into one view. Teams can map foot traffic, nearby competitors, complementary businesses, roads, customers, and existing stores.
Geospatial data helps retailers assess:
- Activity and movement around the site
- Nearby competitors and commercial clusters
- Customer profile fit
- Access and road connectivity
- Distance from existing locations
- Local demand
- Possible store overlap
Traditional site selection often relies on population within a fixed radius and simple competitor counts.
Geospatial analysis provides a more realistic view of how people use an area.
| Traditional Site Assessment | Geospatial Site Assessment |
|---|---|
| Population within a fixed radius | Actual movement and customer catchments |
| Number of nearby competitors | Competitor presence and visit activity |
| Distance from major roads | Real accessibility and movement flows |
| Total market population | Relevant customers and addressable demand |
| Distance from existing stores | Trade area overlap and cannibalization risk |
This makes site comparisons more consistent. It also reduces dependence on intuition or broker-provided information alone.
How Geospatial Data Improves Trade Area Analysis in Retail
A trade area is the geographic area from which a store attracts customers.
Many retailers still define trade areas using circles drawn around a location. However, customers rarely travel evenly in every direction.
Trade area analysis in retail should account for roads, travel times, public transport, urban density, physical barriers, competitor locations, and customer movement.
Geospatial data can create more realistic trade areas based on actual visits and movement patterns.
It can help retailers understand:
- Where customers come from
- How far they travel
- Which neighborhoods generate demand
- Whether stores serve the same customers
- Where network coverage is weak
- Which areas are underserved
- Whether a new store may reduce demand at an existing one
For example, two stores five miles apart may serve different customers if a highway, river, or transport network separates their catchments.
In another market, stores ten miles apart may compete heavily because customers follow the same commuting route.
Dynamic trade area analysis provides a more accurate view of store influence than a fixed radius.
How Geospatial Data Helps Retailers Evaluate Markets
Market evaluation looks beyond one property.
It helps retailers decide which cities, districts, or territories offer the strongest opportunities for growth.
Geospatial data supports retail industry market analysis by comparing markets using the same measures.
These may include customer movement, audience fit, competitor saturation, retail density, store coverage, economic conditions, and local demand.
| Market Signal | What It Indicates |
|---|---|
| Mobility volume | Level of real-world activity |
| POI density | Strength of the commercial environment |
| Competitor presence | Market saturation and competitive pressure |
| People attributes | Fit with the target customer |
| Existing store coverage | Network gaps and overlap |
| Economic indicators | Spending potential and market stability |
| Visit patterns | Relative strength of retail locations |
A fast-growing population does not always make a market attractive.
The market may still have heavy competition, weak customer movement, or poor alignment with the retailer’s target audience.
A smaller market may offer more potential when demand is concentrated, competition is limited, and the right customers are present.
This approach also strengthens retail industry competitive analysis. Retailers can compare competitor coverage, visit activity, customer overlap, and market saturation across locations.
For broader retail sector analysis, geospatial data adds local evidence to demographic, economic, and sales information.
Sites, Trade Areas, and Markets Answer Different Questions
These three levels are connected, but each supports a different decision.
| Evaluation Level | Core Question | Key Signals |
|---|---|---|
| Site | Can this specific location perform? | Mobility, access, nearby POIs, competition, customer fit |
| Trade area | Where will customers come from? | Visitor origins, movement, travel time, overlap |
| Market | Is this market worth entering? | Demand, saturation, economic activity, network coverage |
Retailers should evaluate all three levels together.
A strong market does not mean every site within it will perform well. A promising site may still overlap too heavily with an existing store.
A large trade area may contain many people but few customers who fit the brand.
Connecting site, trade area, and market analysis creates a more balanced expansion decision.
A Practical Geospatial Evaluation Process
1. Define the Decision
Start with the question the analysis must answer.
The goal may be to select a site, enter a market, relocate a store, evaluate a trade area, or improve the current network.
2. Choose the Geographic Level
Decide whether the analysis should focus on a property, neighborhood, catchment, city, or larger market.
Using the wrong level can hide important local differences.
3. Add Internal Retail Data
Include sales, inventory, transactions, profitability, customer records, and store performance where available.
This provides the internal benchmark.
4. Add External Geospatial Signals
Combine internal data with mobility, visits, POIs, people, market, and economic information.
These signals help explain the conditions around store performance.
5. Create Comparable Measures
Build consistent metrics for demand, competition, accessibility, customer fit, market activity, and store overlap.
Using the same measures makes comparisons clearer.
6. Validate Against Existing Stores
Test whether the selected signals explain the performance of current locations.
A model that cannot separate strong and weak existing stores may not provide a reliable view of new opportunities.
What to Look for in a Geospatial Data Provider
Retail mapping and location analysis depend on accurate, current, and usable data.
Retailers should evaluate:
- Geographic coverage
- POI accuracy and category depth
- Update frequency
- Mobility and visit methodology
- Historical data availability
- Geographic detail
- Consistent location identifiers
- API, bulk, and cloud delivery
- Privacy-aware data collection
- Aggregate-only mobility analysis
- Sensitive-place filtering
- Ease of joining external and internal data
Coverage alone is not enough.
The data must also be standardized and easy to connect with store, sales, customer, and market records.
How Factori Helps Retailers Evaluate Sites, Trade Areas, and Markets
Factori combines Mobility, Visit Intelligence, Places, People, Market, and Economic Data to help retailers compare locations using real-world context.
Retail teams can use Factori to evaluate site potential, study nearby competitors, define trade areas, compare markets, identify expansion opportunities, and assess cannibalization risk.
Factori also supports retail mapping with consistent, normalized data across sites and markets. This helps teams move from separate reports to a repeatable location evaluation process.
Conclusion
Geospatial data helps retailers evaluate opportunities at three connected levels.
Sites show whether a specific property can perform. Trade areas show where customers are likely to come from. Markets show where the retail network has room to grow.
By combining mobility, Places, visit, people, market, and internal store data, retailers can make stronger decisions about site selection, customer catchments, market entry, store overlap, and network planning.
Geospatial data for retail industry decisions is most useful when it connects directly to store performance and investment outcomes.
Frequently Asked Questions
What Is Geospatial Data in the Retail Industry?
Geospatial data is information connected to a location, area, route, boundary, or coordinate.
In retail, it can include stores, competitors, mobility patterns, customer visits, trade areas, audience profiles, and market conditions.
How Is Geospatial Data Used for Retail Site Selection?
Retailers use geospatial data to compare foot traffic, access, competition, customer fit, nearby businesses, and overlap with current stores.
This provides more context than population and distance alone.
What Is Retail Mapping?
Retail mapping is the process of displaying stores, competitors, customers, trade areas, movement, and market signals on a map.
It helps teams compare locations and identify patterns that may be difficult to see in spreadsheets.
Can Geospatial Data Identify Retail Cannibalization?
Yes.
Retailers can compare visitor origins, movement patterns, store catchments, and customer overlap to estimate whether a proposed location may shift demand from an existing store.
What Is the Difference Between Geospatial Data and Location Intelligence?
Geospatial data is the information connected to locations and geographic relationships.
Location intelligence is the business insight created by analyzing that data.
Which Geospatial Datasets Are Most Useful for Retailers?
Useful datasets include Places and POI data, mobility data, visit intelligence, people data, market and economic data, and internal store performance data.