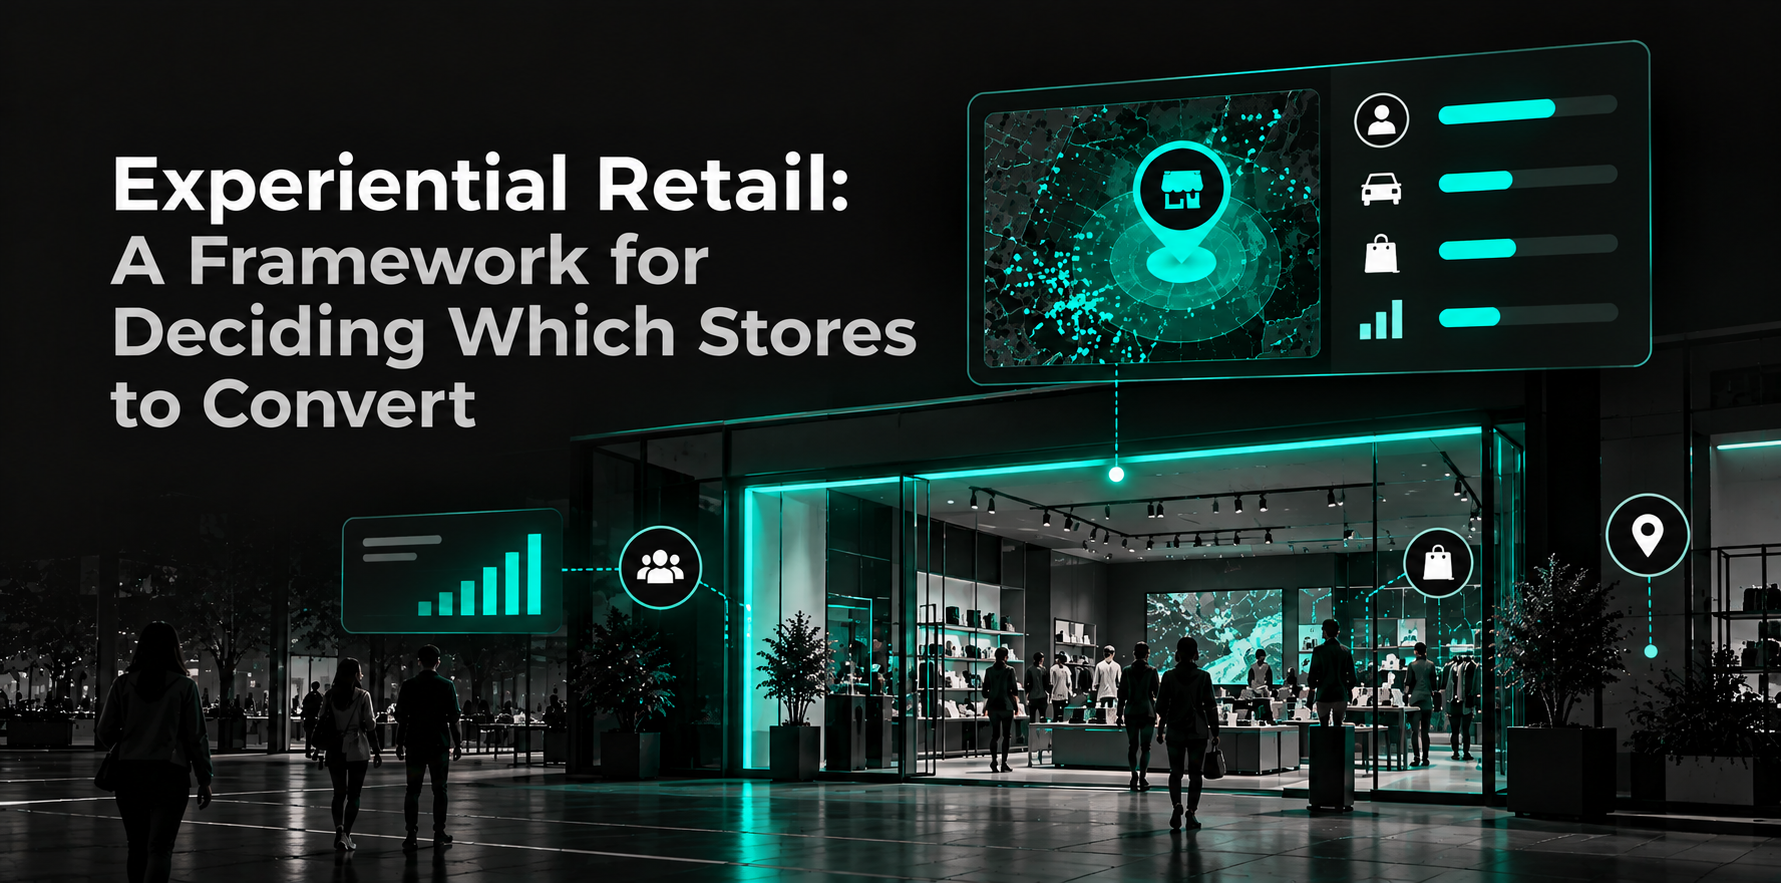
Experiential retail turns a physical store into more than a place to transact. A store may add demonstrations, services, events, product discovery, immersive brand elements, or other reasons for customers to visit in person rather than complete the same journey online.
That makes experiential retail a portfolio decision, not just a design decision. Retailers need to identify which locations already show the visitor behavior, trade-area strength, surrounding POI context, and network characteristics that make experiential investment more defensible.
Key Takeaway
- High foot traffic alone does not make a store a strong experiential retail candidate.
- Repeat visitation, visitor origins, trade-area reach, POI context, and cross-shopping can reveal whether a location already behaves like a destination.
- Cannibalization matters because additional visits at one converted store may simply shift demand from nearby locations.
- Retailers should compare stores using the same evaluation framework rather than relying on flagship status or intuition.
- Real-world data can help identify which stores to test first before committing to a broader rollout.
What Makes a Store Suitable for Experiential Retail?
Experiential retail gives customers a reason to do more than enter, buy, and leave. The location needs to support deeper engagement, repeat visits, or destination behavior rather than relying only on convenient access.
For portfolio planning, the more useful question is not whether a store could become experiential. It is whether the location shows enough evidence that an experiential format could create incremental value.
A Data-Driven Framework for Experiential Retail Conversion
A conversion framework should combine multiple signals instead of allowing one metric to dominate the decision. Foot traffic is a useful starting point, but it should be interpreted alongside repeat behavior, trade areas, POI context, cross-shopping, audience fit, and network overlap.
1. Start With Visit Volume
Visit volume shows whether a location already attracts enough physical activity to support a higher-investment format. It can also help retailers compare stores on a consistent basis before adding more detailed signals.
Useful measures include:
- Total visits
- Visits by day of week
- Visits by daypart
- Visit volume relative to comparable stores
The key is not to automatically promote the busiest stores to the top of the list. Foot traffic tells you how much activity exists, but it does not tell you whether those visitors are likely to engage more deeply with the brand.
For a broader view of how store visits can be interpreted, Factori’s foot traffic analytics guide explains how visitation data can support store comparison and location analysis.
2. Measure Repeat Visitation
An experiential format needs more than novelty. If customers visit once for an event or new feature and never return, the format may generate attention without creating durable value.
Retailers should compare repeat visitor share, visit frequency, and return intervals across stores. A location with moderate traffic but stronger repeat behavior may be a better experiential candidate than a busier store dominated by one-time visits.
The decision question is straightforward: does this store already give people a reason to come back?
3. Understand Visitor Origins and Trade Area
Visitor origins help distinguish a convenience-led store from one that already behaves more like a destination. If visitors regularly travel from a wider area, the location may have stronger potential to support experiences that justify a longer trip.
A trade area analysis can help retailers examine where visitors come from, how broad the catchment is, and whether nearby stores draw from the same areas.
Retailers can compare:
- Visitor origin distribution
- Trade-area size
- Drive-time bands
- Local versus wider-area visitation
- Trade-area overlap with nearby stores
The question is whether the location already has enough destination strength to support a format designed to attract deeper engagement.
4. Evaluate the Surrounding POI Mix
An experiential store does not operate in isolation. Restaurants, entertainment venues, shopping centers, fitness destinations, hotels, and complementary retailers can all influence the type of trip people make to an area.
POI Data can help retailers compare the surrounding commercial environment across candidate stores. Teams can evaluate complementary categories, destination anchors, nearby competitors, and the density of other businesses.
This matters because a store inside a strong destination ecosystem may have a better foundation for experiential retail than a similarly busy store surrounded mainly by convenience-oriented uses.
5. Look at Cross-Shopping Behavior
POI density tells you what is nearby. Cross-shopping tells you whether the same visitors actually use those places.
A store may sit next to restaurants, entertainment, and other retailers without sharing meaningful visitor overlap with them. Another location may show strong co-visitation with complementary destinations, indicating that customers already make multi-stop trips around the area.
Useful comparisons include:
- Shared visitors with complementary retailers
- Competitor cross-visitation
- Co-visitation with F&B
- Co-visitation with entertainment destinations
- Overlap with major shopping centers or anchors
Cross-shopping can help distinguish between a location that merely sits inside a busy area and one that is genuinely part of a destination-shopping journey.
6. Check Audience Fit
A strong experiential concept still needs to be located where the intended audience is present. Total market size is less useful if the relevant audience is concentrated elsewhere.
Retailers can use Audience Data to add context around the people present within the store’s broader market or trade area. This can help teams compare audience concentration across stores without relying only on total foot traffic.
The purpose is not to add as many audience filters as possible. It is to determine whether the store and the intended experiential concept make sense for the same local market.
7. Measure Cannibalization Risk
An experiential conversion may increase visits at one location while reducing visits to another store in the same network. If that happens, the converted store can appear successful even though the portfolio has generated limited incremental demand.
Factori’s retail store cannibalization framework focuses on the difference between new demand and redistributed demand. Trade-area overlap, shared visitors, network density, and proximity to existing stores can all help identify where that risk is higher.
Before converting a store, ask whether the new format is likely to expand the brand’s reach or simply shift existing customers to another location.
Build an Experiential Retail Conversion Score
The individual signals become more useful when stores are evaluated consistently.
| Signal | What to Measure | Why It Matters |
| Visit volume | Total and comparative visits | Tests whether enough physical activity exists |
| Repeat visitation | Repeat share and frequency | Indicates return potential |
| Trade area | Visitor origins and catchment | Shows destination strength |
| POI context | Nearby categories and anchors | Measures support from the surrounding area |
| Cross-shopping | Shared visitation with relevant places | Shows multi-destination behavior |
| Audience fit | Relevant audience presence | Tests market relevance |
| Cannibalization | Shared visitors and trade-area overlap | Tests whether demand is incremental |
A retailer could score each dimension from 1 to 5 and compare locations within the same portfolio. The score should not be treated as a universal formula because the weighting should reflect the brand, format, market, and objective.
The same principle applies to retail site selection: a strong decision usually comes from combining multiple signals rather than allowing one metric to determine whether a location is attractive.
Example: Three Stores, Three Different Signals
Consider three existing stores being evaluated for an experiential conversion.
Illustrative Example, Not Factori Data
| Signal | Store A | Store B | Store C |
| Visit volume | High | Medium | High |
| Repeat visitation | Low | High | Medium |
| Trade-area reach | Local | Broad | Medium |
| POI mix | Limited | Strong | Strong |
| Cross-shopping | Low | High | Medium |
| Audience fit | Medium | High | High |
| Cannibalization risk | High | Low | Medium |
Store A looks strongest if the team evaluates only total visits. Once the other signals are added, Store B becomes more interesting because it combines repeat visitation, broader destination reach, supportive POIs, and lower overlap with the existing network.
That is the purpose of the framework. It prevents one visible metric from becoming the entire investment case.
Which Stores Should Retailers Prioritize?
The strongest candidates usually have several signals pointing in the same direction. They may already behave like destinations, attract repeat visitors, sit inside complementary commercial environments, and draw visitors without heavily overlapping nearby stores.
Stores worth prioritizing for pilots often show:
- Healthy visit volume relative to comparable locations
- Strong repeat visitation
- Broader or strategically relevant trade areas
- Complementary nearby POIs
- Meaningful cross-shopping
- Good audience fit
- Manageable cannibalization risk
A flagship can still be the right choice, but flagship status should not replace the evidence.
Which Stores Should Be Lower Priority?
Some busy stores may be poor experiential candidates. High pass-through visitation, low repeat behavior, limited complementary activity, or heavy trade-area overlap can weaken the case for conversion.
The same applies when a location already performs its network role effectively as a convenience-led store. A more expensive experiential format only makes sense if there is a credible reason to believe the new role can create additional value.
Test Before Scaling Experiential Retail Across the Portfolio
Experiential formats can require significant investment, which makes controlled testing important. A single successful flagship does not prove that the same concept should be rolled out across every market.
A practical test should establish the baseline before conversion and compare pilot stores with similar non-converted stores. Retailers can then examine whether visitation, repeat behavior, trade-area reach, and other agreed KPIs differ enough to justify a wider rollout.
A simple process is:
- Score candidate stores using the same framework.
- Select a small number of high-scoring pilot locations.
- Match each pilot with comparable control stores.
- Establish pre-conversion baselines.
- Measure post-conversion behavior against the baseline and controls.
- Scale only where the evidence supports it.
Where Real-World Data Fits
Internal sales and operational data show how a store performs inside the four walls. Real-world data adds context about visitors, surrounding places, customer origins, and how stores relate to the rest of the network.
Factori provides Mobility Data, Places Data, Audience Data, Business Data, and other real-world datasets that can support store comparison, trade-area analysis, cross-shopping, competitor analysis, cannibalization assessment, and portfolio prioritization.
This gives retailers a consistent external view across locations before committing capital to an experiential conversion.
Conclusion
The best experiential retail candidate is not necessarily the biggest flagship or the store with the highest foot traffic. A stronger candidate is one where visit behavior, trade-area reach, surrounding POIs, cross-shopping, audience fit, and network role collectively support the investment.
A data-driven framework gives retailers a more defensible way to decide where to test, where to scale, and where not to convert. Experiential retail then becomes a portfolio decision supported by evidence rather than a format applied uniformly across the network.
FAQs
What Is Experiential Retail?
Experiential retail is a store strategy that gives customers reasons to engage with a physical location beyond completing a transaction. It can include services, demonstrations, interactive environments, events, education, entertainment, or other experiences that are difficult to replicate online.
How Do You Decide Which Stores Should Become Experiential?
Retailers can compare stores using visit volume, repeat visitation, visitor origins, trade-area reach, surrounding POIs, cross-shopping, audience fit, and cannibalization risk. Using the same framework across the portfolio makes it easier to identify stronger pilot candidates.
Is High Foot Traffic Enough to Justify an Experiential Store?
No. High traffic may come from convenience, pass-through activity, tourism, or one-time visits and may not indicate strong experiential potential.
Foot traffic should be considered alongside repeat behavior, trade-area characteristics, POI context, cross-shopping, and network overlap.
How Should Retailers Test an Experiential Retail Concept?
Start with a small number of stores selected through a consistent evaluation framework. Establish pre-conversion baselines, use similar non-converted stores as comparisons, and measure agreed outcomes before expanding the format.
What Data Is Useful for Experiential Retail Planning?
Useful inputs can include store performance data, Mobility Data, Visit Data, Places Data, visitor origins, trade areas, cross-shopping, Audience Data, and competitor locations. The strongest framework combines internal store performance with external real-world context.