A store five miles away is not always easier to reach than one eight miles away. Highways, local roads, congestion, bridges, turn restrictions, and other parts of the road network can make straight-line distance a poor representation of customer access.
Drive time analysis gives retailers a better way to evaluate accessibility. It defines the area that can reach a location within a set travel time, then allows teams to compare population, competition, customer activity, and market potential inside that area. But drive time should not automatically be treated as the store’s actual trade area. It is strongest when combined with observed customer and mobility data.
Key Takeaway
- Drive time analysis measures accessibility using travel time rather than straight-line distance.
- A drive-time area represents who could reach a store within a defined period, not necessarily who actually visits it.
- Road networks, traffic conditions, store format, and market density can materially change the size of a drive-time area.
- Drive-time zones become more useful when enriched with POI, demographic, mobility, visit, and competitor data.
- Retailers should compare modeled drive-time areas with observed trade areas before using them for site selection or expansion decisions.
What Is Drive Time Analysis?
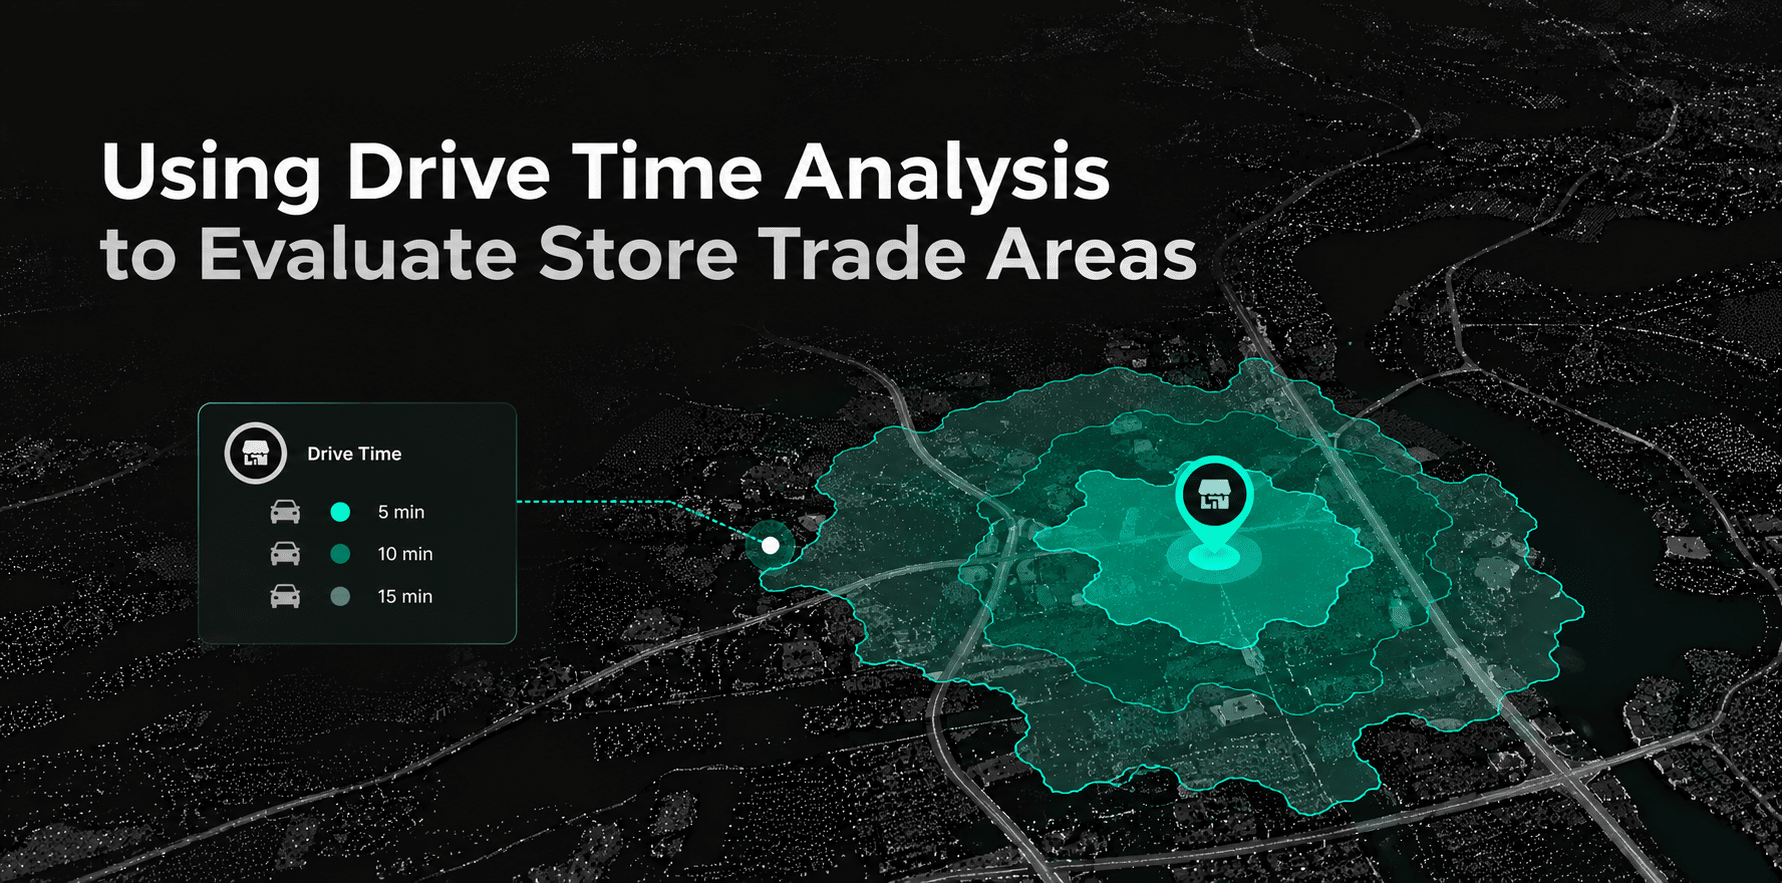
Drive time analysis calculates the geographic area reachable from a location within a defined amount of driving time. A 10-minute drive-time area, for example, represents locations from which a driver can reach the store within approximately 10 minutes under the traffic and routing assumptions used in the analysis.
Tools such as Esri Business Analyst generate drive-time trade areas using transportation networks and configurable travel-time settings rather than straight-line distance.
Retail teams often compare 5-, 10-, 15-, or 20-minute drive times around candidate sites. The correct threshold depends on the business model. A convenience-led location may rely heavily on nearby customers, while a destination retailer may attract visitors willing to travel much farther.
The value of drive time analysis is therefore not the polygon itself. It is the ability to compare accessible markets on a consistent basis.
Drive Time Areas and Radius Rings Measure Different Things
A radius ring measures geographic distance from a point. Every location five miles from the store is treated as equally close.
Drive time analysis follows the transportation network instead. A highway may make a relatively distant neighborhood easy to reach, while a river, congestion point, or indirect road network can make a physically close neighborhood less accessible.
That makes drive time useful for comparing accessibility, but it does not make radius analysis obsolete. Radius rings can still provide a fast, standardized geographic comparison. Problems arise when a radius is treated as evidence of how customers actually travel.
| Method | What it represents | Useful for | Main limitation |
| Radius | Straight-line proximity | Quick market screening | Ignores roads and travel conditions |
| Drive time | Modeled accessibility | Site comparison and reachable-market analysis | Does not show actual visitor origins |
| Observed trade area | Where visitors originate | Customer reach and behavioral overlap | Depends on visit and mobility methodology |
This distinction matters because accessible market and actual trade area are not the same thing.
What Should You Measure Inside a Drive-Time Area?
A drive-time polygon becomes useful when other data is added to it.
Population and Customer Profile
How many potential customers can reach the site within 5, 10, or 15 minutes?
Population alone is not enough. Retailers should also examine whether the people inside the reachable market align with the concept’s target audience and how that composition changes across different drive-time bands.
Competitors and Nearby Businesses
POI data can identify competing stores, shopping centers, complementary businesses, anchors, restaurants, and other destinations inside the drive-time area.
A large accessible population may look attractive until the same market contains several established competitors. In another location, nearby complementary businesses may strengthen destination activity.
Mobility and Visitation
Accessibility tells you who can reach a site. Mobility and visit data can provide evidence about whether people actually move through or visit that market.
Two candidate locations may have similar 10-minute populations but very different levels of observed activity. Retail location analysis therefore becomes stronger when accessibility is evaluated alongside movement and visitation.
Market Context
Drive-time areas can also be enriched with economic conditions, business activity, market growth, or other external indicators. These layers help distinguish a large reachable population from a market showing stronger commercial potential.
A 10-Minute Drive Time Is Not Universal
Using the same travel-time threshold for every concept can create misleading comparisons.
Customer willingness to travel depends on purchase frequency, store format, destination strength, and the alternatives available nearby. A convenience store and a destination furniture retailer should not automatically be evaluated using the same travel-time assumptions.
Time of day also matters. A 10-minute drive-time area during morning congestion may look very different from the same calculation in the afternoon. INRIX drive-time analysis accounts for travel conditions and allows accessibility to be evaluated using time rather than only physical distance.
Retailers should therefore test drive-time assumptions based on:
- store format
- purchase frequency
- urban versus suburban environment
- destination strength
- weekday versus weekend
- traffic conditions
The objective is not to find one universal drive time. It is to choose a travel-time assumption that reflects how customers are likely to access that type of location.
Compare Candidate Sites on More Than Reach
Consider two proposed stores.
Both can reach 80,000 people within 15 minutes. If analysis stops there, the markets may appear similar.
But Site A might have stronger observed retail activity, fewer competing locations, and access to several high-traffic commercial corridors. Site B may reach the same population while overlapping heavily with an existing store and competing with several established locations.
The accessible population is the same. The opportunity is not.
A stronger comparison would examine:
| Factor | Site A | Site B |
| 15-minute accessible population | Compare | Compare |
| Target audience fit | Compare | Compare |
| Competitor density | Compare | Compare |
| Nearby destination mix | Compare | Compare |
| Observed visitation | Compare | Compare |
| Existing-store overlap | Compare | Compare |
| Market conditions | Compare | Compare |
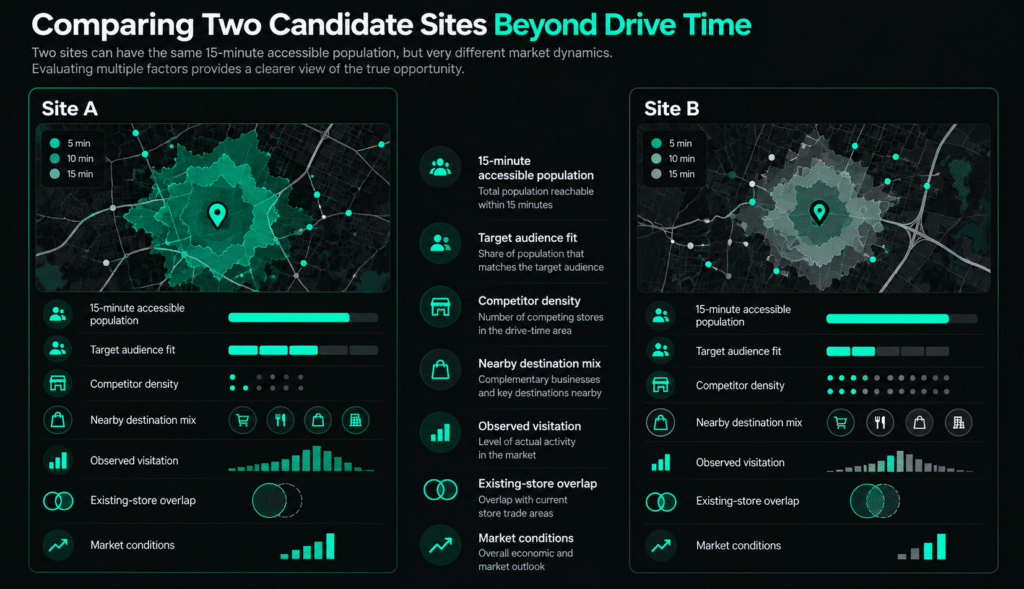
This is where drive time analysis moves from map visualization to site evaluation.
Use Observed Trade Areas to Validate Drive-Time Assumptions
Drive time analysis answers:
Who can reasonably reach this location?
Observed trade-area analysis answers:
Where are actual visitors coming from?
For existing stores, aggregated mobility data can show visitor origins and catchment patterns. Comparing those observed trade areas with 5-, 10-, and 15-minute drive-time zones can reveal which travel threshold best approximates real customer behavior.
That historical evidence can then improve assumptions used for new sites.
If stores in the same format consistently attract activity from beyond a standard 10-minute zone, relying only on that threshold may understate potential reach. Conversely, a large drive-time polygon may overstate demand if customers usually choose closer alternatives.
This also matters for retail cannibalization analysis. Two proposed stores may have overlapping drive-time areas, but the commercial risk depends on how much customer behavior is actually shared between them.
How to Use Drive Time Analysis in Site Selection
A practical workflow can remain simple.
- Generate comparable drive-time zones. Use consistent routing and traffic assumptions for each candidate site.
- Measure what is inside each zone. Add population, audience characteristics, competitors, complementary businesses, and market context.
- Compare observed activity. Use mobility or visitation data to determine whether reachable demand corresponds with actual market activity.
- Check network overlap. Compare candidate drive-time areas with existing stores to identify potential cannibalization.
- Score sites using multiple signals. Accessibility should influence the decision, but it should not become the decision by itself.
This broader approach is consistent with trade area analysis, where accessibility, movement, competition, and customer context are evaluated together.
Where Factori Fits
Factori provides real-world data that can add market context to drive time analysis.
Teams can combine Places, mobility, visits, people, audience, market, economic, business, and geographic data to understand what exists inside a reachable market and how people interact with it. A retailer can compare competitor density inside a 15-minute drive-time zone, examine visitation around the candidate market, and test whether observed customer movement supports the accessibility model.
The goal is not to replace routing or drive-time engines. It is to enrich drive-time areas with the real-world signals required to compare locations more completely.
Factori data can be integrated through APIs, cloud delivery, files, and the Factori Platform.
Conclusion
Drive time analysis gives retailers a more realistic view of accessibility than straight-line distance alone. It helps teams understand how much of a market can reach a candidate store and how that reach changes with road networks, traffic conditions, and travel time.
But accessibility is only one part of a trade area. The strongest location analysis combines drive time with POI, customer, market, mobility, and observed visitation data. That allows retailers to compare not just who can reach a site, but whether the surrounding market provides enough evidence to support the location.
FAQs
Can drive time analysis be used for competitor analysis?
Yes. Retailers can compare the number, type, and distribution of competitors inside each drive-time zone. Adding mobility or visitation data can strengthen the analysis by showing whether those competitors also attract significant activity.
How should traffic conditions be handled in drive time analysis?
Traffic assumptions should match the decision being made. Morning peak, evening peak, weekday, and weekend conditions can produce different reachable markets around the same site, so retailers should avoid relying on one time-of-day calculation when traffic materially affects access.
Can drive time analysis help identify cannibalization risk?
It can identify where candidate and existing store catchments overlap, but overlap alone does not prove cannibalization. Observed trade areas, visitor origins, and store performance should also be considered before estimating how much demand may shift between locations.
What data should be layered onto a drive-time map?
Useful layers include population, audience characteristics, competitor locations, POIs, mobility, visitation, market activity, and economic conditions. The right combination depends on the decision being made and the format being evaluated.
How should retailers compare multiple drive-time areas?
Use consistent travel-time bands and routing assumptions, then compare accessible population, audience fit, competition, nearby destinations, observed activity, existing-store overlap, and market context. This creates a more meaningful comparison than looking at polygon size alone.