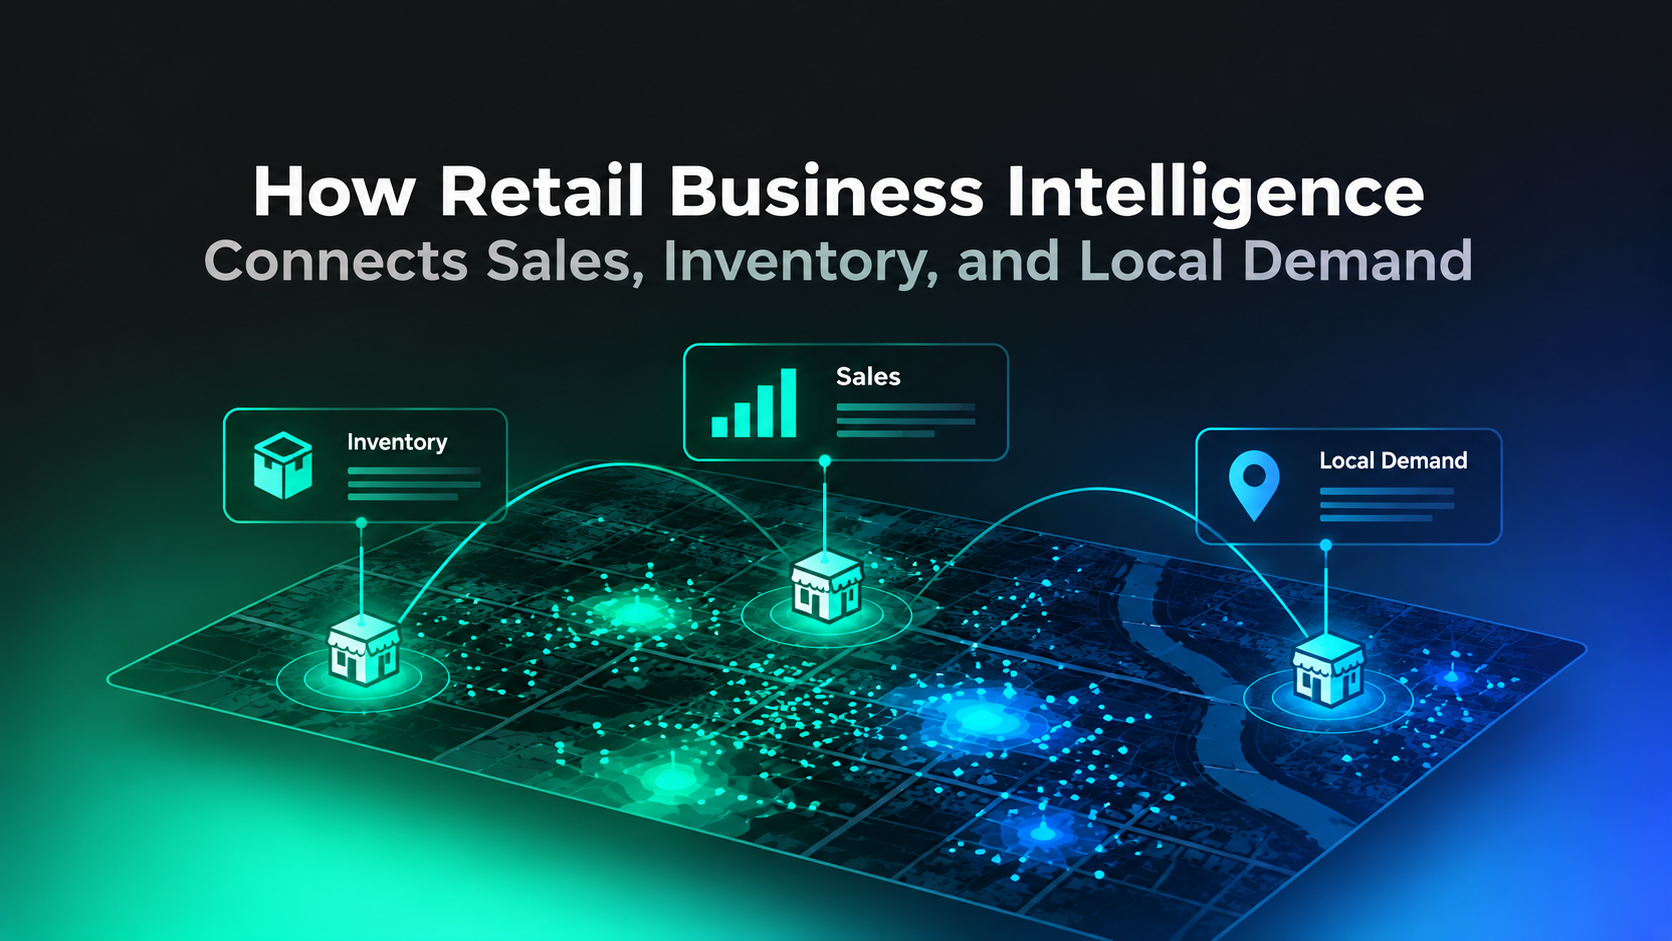
Retail business intelligence (retail BI) combines sales, inventory, customer, operational, and external market data to guide retail decisions. BI in the retail industry helps teams identify performance gaps, allocate stock, assess promotions, and prioritize stores for investment.
The challenge is deciding what to do when those signals disagree. Higher sales can conceal weaker margins, while lower sales can reflect unavailable stock rather than declining demand.
Key Takeaway
- Retail BI should connect each performance issue with evidence, an accountable owner, and a testable business action.
- Sales, profitability, inventory availability, customer behavior, and location activity need to be evaluated together.
- Repeat visits and cross-shopping provide behavioral context but do not establish purchasing or causation.
- Shared store identifiers, reporting periods, and metric definitions prevent misleading comparisons.
- External data earns its place when it improves decisions, forecast accuracy, or commercial outcomes.
What Data Does Retail Business Intelligence Need?
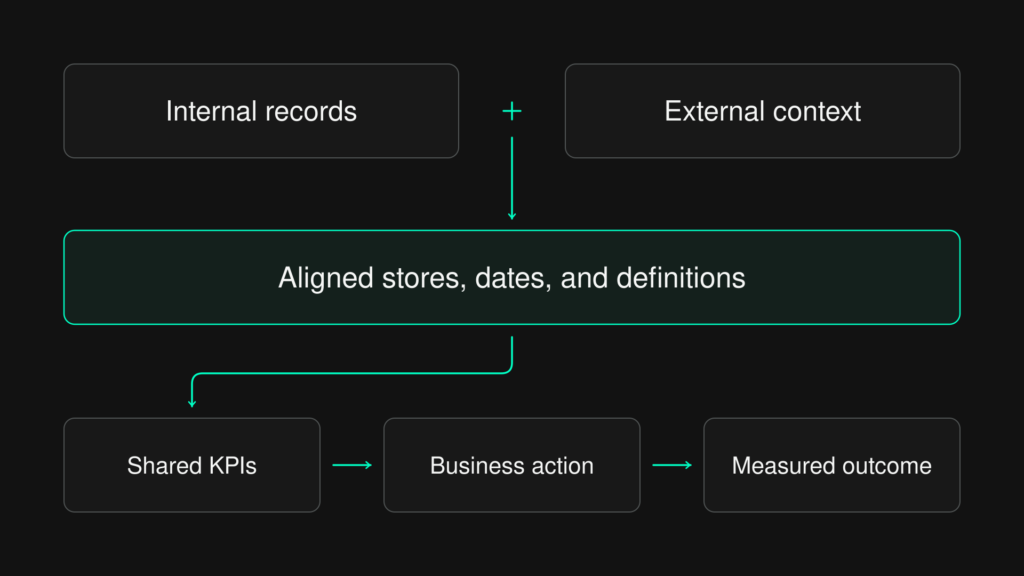
Retail BI needs internal records of business performance and external context relevant to the decision. Keep each source’s measurement role clear before combining it with other data.
Point-of-sale (POS) systems capture transactions, inventory systems track availability, and finance systems establish costs. Loyalty records identify permitted purchase histories, while e-commerce data adds product views, cart abandonment, and online orders.
Places Data describes surrounding businesses and competitors, while Mobility Data adds aggregated visitation and visitor-origin context. Events Data, Weather Data, and Economic Data can help test external explanations, but estimated visits are not transactions or exact door-counter entries.
How Is BI Used in the Retail Industry?
Retailers use BI to distinguish operational problems from market conditions and choose an intervention. Each application should connect a business question with evidence that changes the decision.
Diagnose Store Performance and Competition
When entries decline but transactions per entry hold steady, investigate acquisition, accessibility, and surrounding activity. When entries remain steady but transactions fall, examine staffing, availability, and checkout friction.
Compare external visitation using equivalent store formats, periods, boundaries, and measurement methods. Indexed changes can provide directional context, but they are not precise competitor sales or market share.
Improve Inventory Allocation and Assortment
Combine product sales with availability before interpreting demand. Weak sales during a stockout do not establish weak customer interest.
Compare weeks of supply, replenishment lead times, and category performance across similar stores. Test whether local events, weather, and visitation improve allocation, and evaluate transfer costs before moving stock.
Understand Customer Behavior and Local Marketing
Repeat purchase rate measures the share of identified purchasing customers who buy at least twice within a defined period. Repeat visitation measures return visits, while cross-shopping describes visitor overlap between locations during a specified window.
These signals answer different questions: shared visitors do not establish shared purchases or a same-trip journey. Combine permitted customer history with trade area analysis, the study of where a store draws visitors, to test local offers and partnerships.
Evaluate Expansion and Cannibalization
Retail site selection combines comparable-store economics with competition, accessibility, and catchment evidence. Cannibalization is demand transferred between locations within the same retail network.
Overlapping trade areas indicate exposure, not proven lost sales. Model transferred demand and operating costs before judging a new location by its projected sales alone.
Which KPIs Should a Retail BI Dashboard Track?
Track metrics that distinguish growth, profitability, stock productivity, and execution. Keep reporting periods, store eligibility, and denominators consistent.
| KPI | Definition or calculation | Decision supported |
| Net sales | Sales minus discounts, returns, and allowances | Revenue performance |
| Comparable-store growth | Percentage sales change across the same eligible stores and periods | Existing-network performance |
| Gross margin percentage | (Net sales minus cost of goods sold) ÷ net sales × 100 | Product profitability |
| Average transaction value | Net sales ÷ eligible transactions | Basket value |
| Sales per square foot | Net sales ÷ selling area | Space productivity |
| Inventory turnover | Cost of goods sold ÷ average inventory at cost | Inventory investment |
| GMROI | Gross profit ÷ average inventory at cost | Inventory return |
| Transaction conversion proxy | Eligible in-store transactions ÷ counted entries × 100 | In-store conversion |
| Forward weeks of supply | Available units ÷ forecast average weekly unit demand | Replenishment |
| Forecast mean absolute error (MAE) | Average absolute forecast error | Planning accuracy |
Gross margin return on inventory investment, or GMROI, uses inventory valued at cost. Conversion remains a proxy because entries and transactions do not represent unique purchasing customers.
Retail BI Example: Why Higher Sales Can Mean Lower Profit
Retail BI should identify whether revenue growth improves economics before recommending more investment. Suppose a retailer compares two equivalent trading periods around a promotion.
| Metric | Before promotion | During promotion |
| Net sales | $100,000 | $110,000 |
| Door entries | 20,000 | 22,000 |
| Transactions | 4,000 | 4,400 |
| Transaction conversion proxy | 20% | 20% |
| Gross margin | 40% | 34% |
| Gross profit | $40,000 | $37,400 |
Sales increased 10%, but gross profit fell $2,600 and conversion remained unchanged. Internal BI should investigate discounts, product mix, and costs rather than celebrate revenue alone.
Now suppose a consistently measured, same-category external visitation index also rises 10%. That suggests stronger surrounding activity could have contributed to the traffic increase, without proving what caused the store’s result.
The next action is a controlled test of a less expensive offer across comparable stores. Judge the outcome on incremental contribution after campaign costs, not sales growth alone.
What Should a Retail BI Technology Stack Include?
A retail BI stack connects source systems, data storage, shared metric definitions, and reporting tools. An external data provider adds information to that architecture rather than replacing every component.
Power BI or Tableau can provide the reporting interface, while a warehouse holds connected records. Evaluate source integrations, geographic joins, permissions, refresh latency, and total operating cost before buying another dashboard.
Prevent Misleading Data Joins
Microsoft’s star-schema guidance recommends consistent grain, meaning what one row represents, within each fact table. Keep store-day footfall separate from product-store-day sales and connect them through shared dimensions.
Copying daily footfall onto every product row can inflate totals. Align local dates, trading calendars, and store identifiers before comparing performance.
Reconcile Omnichannel Records and Permissions
Count a buy-online-pick-up-in-store order once as a sale and record pickup activity separately. Specify whether each report measures order origin, fulfillment responsibility, or store activity.
Label recorded, modeled, and inferred fields, keeping missing or suppressed values distinct from zero. Use aggregated, privacy-safe mobility outputs, sensitive-place filtering, access controls, and permitted-use rules for partner collaboration.
How Does Factori Support Retail Business Intelligence?
Factori’s retail data offering supplies external context across Mobility Data, Places Data, People Data, Audience Data, Business Data, Events Data, and Economic Data. Teams can integrate relevant datasets through APIs, files, cloud delivery, the Factori Platform, and MCP-enabled workflows.
For retail analytics providers and enterprise teams, the practical test is whether those inputs improve store comparisons or demand forecasting. Start with a representative store sample and an agreed success metric rather than adding every dataset at once.
How Do You Measure Retail BI ROI?
Measure the incremental operating benefit enabled by BI against software, data, implementation, and running costs. Adoption matters, but dashboard views alone do not establish return on investment.
For forecasting, use out-of-sample evaluation and inputs available when each forecast would have been issued. Compare MAE and forecast bias, meaning persistent over- or underforecasting; for operational changes, use suitable comparison stores and measure commercial outcomes.
| Timing | Owner | Action and KPI |
| First 30 days | Data engineering | Reconcile sources; measure join success and time to usable data |
| By day 60 | Analytics and merchandising | Test forecasts and decisions; track error, stockouts, and markdowns |
| By day 90 | Finance and operations | Evaluate incremental contribution, decision speed, and total cost |
Conclusion
Retail business intelligence becomes valuable when it explains which action deserves testing, not just which metric changed. Internal data establishes performance, while real-world context helps distinguish store execution from the surrounding market.
Keep definitions consistent, connect each finding with an owner, and measure the outcome. That makes retail BI a decision process rather than another reporting layer.
FAQs
What Is the Difference Between Retail BI and Retail Analytics?
Retail BI emphasizes shared reporting and performance investigation, while retail analytics also includes statistical modeling and forecasting. The terms overlap, so evaluate capabilities rather than labels.
Can Retail BI Work Without Customer-Level Data?
Yes, inventory, store-performance, and market-planning decisions can use aggregated product, store, and geographic data. Include customer-level information only when the decision requires it and the use is permitted.
How Often Should Retail BI Data Be Updated?
Match updates to the decision window. Replenishment exceptions may require frequent updates, while network investment decisions can use slower refreshes with clearly stated reference periods.
Does AI Replace a Retail BI System?
AI can assist forecasting, anomaly detection, and natural-language analysis. It still needs governed data, consistent metrics, and human review before its recommendations inform business action.