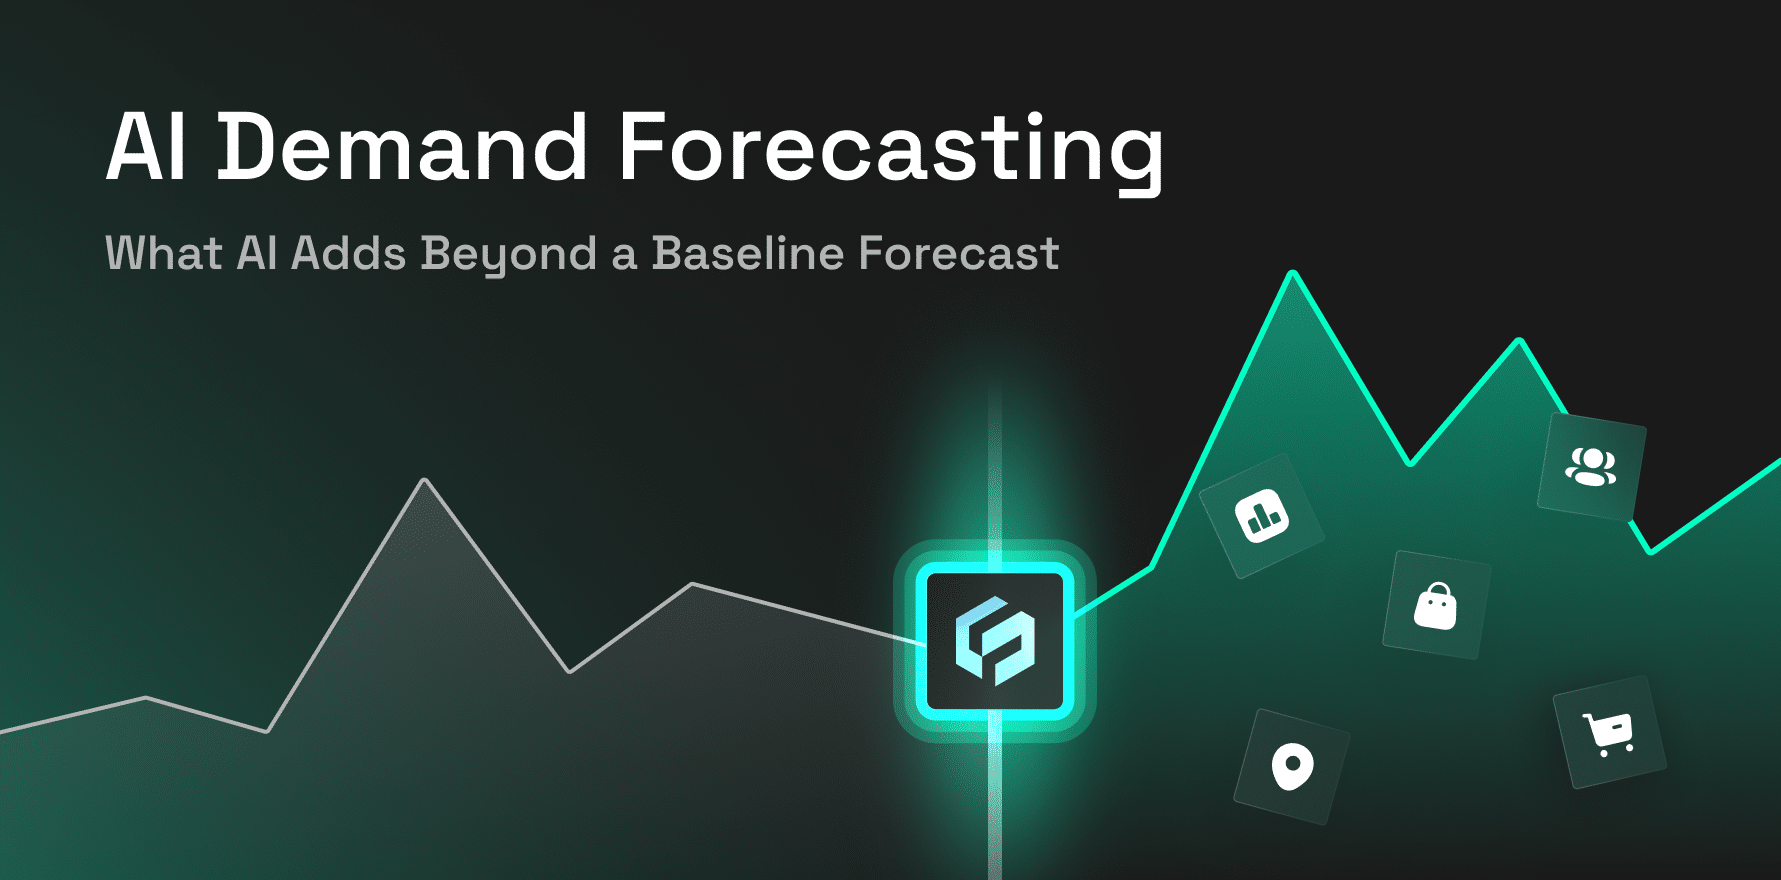
AI demand forecasting uses machine learning and other AI techniques to predict future demand from historical sales, product data, pricing, promotions, store characteristics, and external signals.
A baseline forecast already captures much of what businesses know from past demand, including trend and seasonality. AI becomes valuable when it can identify additional patterns that the baseline misses and improve the forecast at the level where decisions are actually made.
That improvement needs to be measured, not assumed.
Key Takeaway
- AI demand forecasting creates value only when it improves a credible baseline forecast.
- Machine learning can learn across products, stores, and markets while capturing nonlinear demand patterns and feature interactions.
- AI still depends on clean demand history because stockouts, closures, and missing data can distort what the model learns.
- External signals such as mobility, foot traffic, events, and POI changes are most useful when their geography matches the demand being forecast.
- More features do not automatically improve accuracy, so every new signal should prove incremental value against the baseline.
- Forecast performance can change significantly across company, market, store, SKU, and SKU-store levels.
- AI can improve cold-start forecasts for new products, but limited history still creates higher uncertainty.
- Backtesting, strong benchmarks, and continuous revalidation are necessary to prove that an AI forecast actually performs better.
What Does AI Add Beyond a Baseline Forecast?
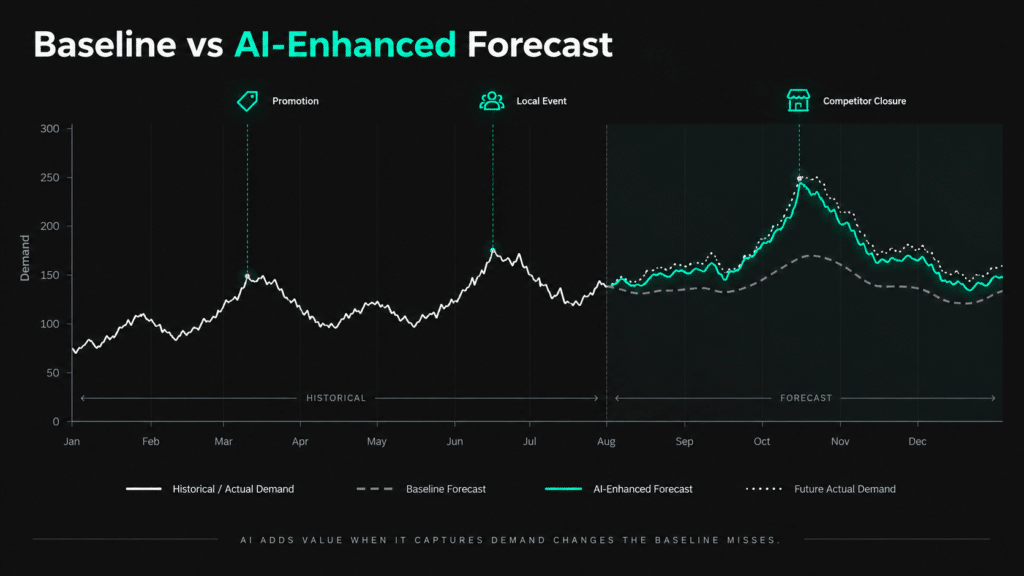
A good baseline might already account for:
- Historical sales
- Trend
- Seasonality
- Day-of-week patterns
- Recurring promotions
AI can extend that baseline by learning from more complex relationships.
| Baseline forecasting | What AI can add |
| Historical patterns | Additional internal and external features |
| Individual time series | Learning across related products and stores |
| Mostly linear relationships | Nonlinear demand patterns |
| Fixed model structure | More flexible feature interactions |
| Limited contextual variables | Geographic and market context |
| Point forecasts | More advanced uncertainty estimates |
The important comparison is not AI versus no forecast.
It is:
Baseline forecast → AI-enhanced forecast → Actual demand
AI creates value only when the second forecast performs better.
Research from the M5 competition showed that machine-learning approaches, explanatory variables, cross-series learning, and forecast combinations can improve large-scale retail forecasting, while simpler methods can still remain competitive in some granular demand series.
AI Still Depends on Good Demand History
Before adding machine learning, the underlying demand data needs to be trustworthy.
Useful historical inputs include:
- Sales
- Orders
- Point-of-sale data
- Returns
- Inventory availability
- Stockouts
- Product launches
- Promotions
Sales and demand are not always the same.
Suppose an item records zero sales because inventory was unavailable. If the model sees only sales, it may interpret that zero as lack of demand rather than lack of supply.
The same problem appears with temporary store closures, missing records, substitutions, canceled orders, and supply disruptions.
AI can learn patterns at scale, but it cannot automatically know whether a zero means zero demand or zero availability.
AI Can Learn Across Products, Stores, and Markets
Traditional forecasting often models demand series individually.
Machine learning can learn patterns shared across many related series.
For example, a retailer might forecast:
500 SKUs × 200 stores × 7 days
Instead of treating every combination as completely independent, an AI model can learn common relationships across products, locations, and time.
That can be useful when similar stores respond to the same seasonal pattern or when several products react similarly to promotions.
This ability to learn across related series is one of the main advantages of AI at large forecasting scale.
AI Can Capture Nonlinear Demand Drivers
Demand does not always respond proportionally to a signal.
Temperature may have little effect on beverage sales between 60°F and 70°F, then demand may rise quickly above 80°F.
A promotion may also behave differently depending on:
- Store location
- Season
- Product category
- Price
- Audience
- Competitor activity
AI models can capture these interactions without requiring planners to define every relationship manually.
That is useful when demand depends on several factors acting together rather than one factor changing independently.
Better Forecasts Need Better Features
AI can process large numbers of variables, but more features do not automatically create a better model.
Forecasting inputs generally fall into three groups.
Historical Demand
Sales, orders, availability, returns, and previous demand patterns.
Business Drivers
Price, promotions, marketing, product attributes, distribution, launches, and channel.
External Demand Signals
Weather, events, competition, demographics, mobility, foot traffic, and local market changes.
Retail demand forecasting usually starts with internal demand patterns. AI can extend that foundation by testing whether additional features explain demand the baseline does not capture.
Real-World Signals Need Geographic Context
Physical demand is local.
A major event near Store A may increase demand there without affecting Store B twenty miles away. A competitor closure may matter only where the two businesses share a market.
Real-world signals can add this context.
| Signal | Possible forecasting value |
| Mobility | Detect changing activity across markets |
| Foot traffic | Identify store-level demand shifts |
| POI changes | Detect competitors or trip generators |
| Events | Capture temporary local demand |
| People data | Add market composition |
| Trade areas | Match signals to reachable customers |
Foot traffic analytics can show whether activity around physical locations is rising or declining.
POI data can add information about nearby competitors, complementary businesses, openings, and closures.
Trade area analysis helps determine whether an external signal falls inside the market a store can realistically serve.
An external feature becomes more useful when its geography matches the geography of the demand being forecast.
Every New Signal Should Beat the Baseline
AI models can accept hundreds of features. That does not mean every feature should remain in the model.
Test each signal for:
Relevance: Does it have a plausible relationship with demand?
Timeliness: Is it available before the forecast must be produced?
Granularity: Does it match the product, store, market, and time period?
Stability: Does the relationship persist?
Incremental value: Does it improve forecast performance?
A simple test is:
Baseline model
vs.
Baseline + new feature
If the added signal does not reduce forecast error or improve another relevant outcome, it may be adding complexity rather than information.
Forecasting Granularity Changes AI Performance
A forecast at company level is very different from a forecast at SKU-store-day level.
A typical hierarchy might be:
Company → Region → Market → Store → SKU
Demand often becomes noisier as the forecast becomes more granular.
An aggregate forecast can show a stable trend while individual stores experience zero-sales days, sudden spikes, local promotions, and market-specific events.
This is why claims such as “AI improves forecast accuracy by 30%” need context.
Performance depends on:
- Forecast level
- Product
- Location
- Horizon
- Demand volatility
- Data availability
AI should be evaluated at the level where the business actually makes decisions.
AI Can Improve Cold-Start Forecasting
New products create a difficult forecasting problem because there is little historical demand.
AI can use information such as:
- Similar products
- Category demand
- Brand
- Price
- Product attributes
- Geography
- Launch plans
- Early sales
These signals can create a more informed starting estimate.
But uncertainty remains high.
AI can improve the cold start. It cannot turn a product with no demand history into a low-risk forecast.
AI Forecasts Should Include Uncertainty
A single number can create false confidence.
Instead of only:
Expected demand: 10,000 units
a forecasting system can also provide:
Likely range: 8,700 to 11,600 units
That range can support decisions around:
- Safety stock
- Procurement
- Production
- Staffing
- Scenario planning
- Service levels
Forecast uncertainty is useful information, not a model failure.
Backtesting Shows Whether AI Actually Helps
A model should not be judged on one forecast period.
Use rolling backtests:
Train → Forecast → Compare with actual demand → Move forward → Repeat
Evaluate results across:
- SKUs
- Stores
- Categories
- Markets
- Forecast horizons
Useful metrics include:
- WAPE
- MAE
- Forecast bias
- Stockouts
- Excess inventory
- Service level
The AI model should also be compared with strong alternatives such as seasonal baselines, existing forecasting methods, and planner forecasts.
A benchmark needs to be difficult enough that beating it matters.
AI Models Need Continuous Revalidation
Demand relationships change.
A competitor can reopen. A product can mature. Mobility patterns can shift. Promotional strategies can change.
The forecasting process should therefore continue as:
Train → Forecast → Observe → Measure → Retrain
Model drift is especially important when external variables play a large role because their relationship with demand may weaken or change over time.
Example: One Product, Five Stores
Suppose historical demand suggests five stores will each sell about 1,000 units next month.
New information shows:
Store A: Major local event → temporary uplift
Store B: Competitor closes → possible sustained uplift
Store C: Foot traffic rises → stronger expected demand
Store D: Local activity declines → lower expected demand
Store E: No meaningful change → baseline remains
A simple network-wide adjustment might treat all five stores similarly.
An AI model with relevant local features can estimate a different demand path for each location.
The value comes from identifying where conditions differ, not from adding complexity everywhere.
When AI Demand Forecasting Fails
AI forecasting becomes weaker when:
Demand history is distorted: The model learns supply problems as demand patterns.
External features are irrelevant: More variables create noise.
Granularity is mismatched: National patterns are applied to local demand.
Data leakage occurs: The model uses information that would not have existed at forecast time.
No benchmark exists: The business cannot prove AI improved the previous forecast.
A more sophisticated algorithm does not fix a weak forecasting process.
How Factori Supports AI Demand Forecasting
Factori provides real-world signals across Places, Mobility, People, Events, and other market datasets that can complement sales, promotions, product, and inventory data.
These signals can add geographic context around local activity, competitors, audience composition, events, trade areas, and changing market conditions for store- and market-level demand models.
Conclusion
Strong AI demand forecasting rests on three foundations.
A credible baseline: AI needs a meaningful forecast to improve.
Useful signals: Added features should explain demand the baseline misses.
Continuous validation: Performance should be measured across products, locations, horizons, and business outcomes.
AI adds value when it reveals stable demand relationships that a simpler forecast could not capture. Without that measurable improvement, a more advanced model is simply a more complicated forecast.
FAQs
What is AI demand forecasting?
AI demand forecasting uses machine learning and other AI techniques to predict future demand from historical data, business variables, external signals, and patterns across related products, stores, or markets.
How is AI demand forecasting different from traditional forecasting?
Traditional methods often focus on historical trend and seasonality, while AI can learn across many demand series and model larger numbers of interacting internal and external variables.
What data does AI demand forecasting use?
Inputs can include sales, orders, inventory, pricing, promotions, product attributes, store information, weather, events, mobility, competition, demographics, and other relevant demand signals.
Is AI demand forecasting more accurate?
It can be, but improvement depends on data quality, forecasting level, demand patterns, model choice, forecast horizon, external features, and the strength of the baseline.
Can AI forecast demand for new products?
AI can use similar products, category patterns, pricing, product attributes, geography, and early demand signals to improve new-product forecasts, although uncertainty remains higher when historical data is limited.