Demand can change faster than traditional forecasting cycles can capture.
A rise in store visits, a shift in local activity, a new competitor, or changing economic conditions can quickly make an existing forecast less reliable.
Demand sensing helps businesses respond to these changes. It combines historical demand with recent internal and external signals to improve short-term visibility.
This supports faster decisions across inventory, planning, marketing, staffing, distribution, and operations.
What Is Demand Sensing?
Demand sensing is a short-term forecasting approach that uses recent data to detect changes in customer demand and adjust existing forecasts.
A simple demand sensing definition is: using current demand signals to improve near-term forecasts.
Traditional forecasting relies heavily on historical sales, seasonality, and longer-term trends.
Demand sensing adds more recent signals such as:
- Sales and orders
- Inventory changes
- Promotions
- Store visits
- Mobility patterns
- Competitor activity
- Local market conditions
The concept of demand sensing is not to replace traditional forecasting.
Instead, it makes an existing forecast more responsive when current conditions begin to move away from historical patterns.
Demand sensing is used across retail, consumer goods, manufacturing, ecommerce, logistics, travel, hospitality, and other industries where demand can change quickly.
How the Demand Sensing Process Works
The demand sensing process continuously compares recent activity with expected demand.
A simple flow is:
Recent signals → Demand change detection → Forecast update → Business action
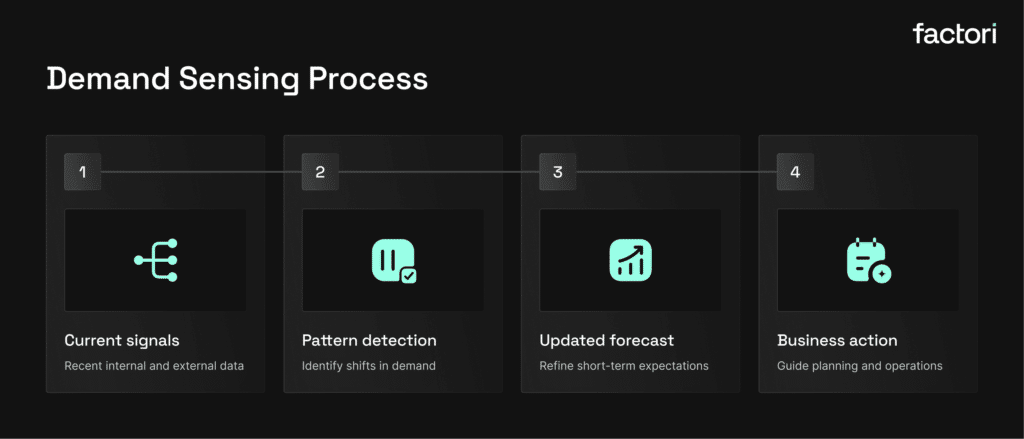
1. Collect Recent Demand Signals
Businesses begin by combining internal data with external market signals.
Internal data may include recent sales, orders, cancellations, inventory levels, promotions, pricing, website activity, product availability, and returns.
External signals can include foot traffic, mobility, competitor visits, local business activity, consumer characteristics, and economic conditions.
The goal is to build a current view of what may be affecting demand.
2. Detect Changes in Demand
Analytics or machine learning models compare current signals with expected patterns.
They may detect stronger sales growth, falling store visits, increased trade area activity, changes between regions, or unexpected promotion performance.
These signals help teams see where demand is moving away from the baseline forecast.
3. Update the Forecast
The short-term forecast is then adjusted.
For example, a retailer may increase expected demand for a store when sales, foot traffic, and local activity are all rising.
Another location may receive a lower forecast if store visits and local demand are declining.
4. Turn the Forecast Into Action
Updated forecasts should connect to operational decisions.
They may support inventory allocation, product replenishment, staffing, promotions, distribution, store operations, or regional sales planning.
A demand sensing solution creates value only when updated signals lead to better decisions.
Demand Sensing vs Demand Forecasting
Demand sensing vs demand forecasting is not an either-or choice.
The two approaches work together.
| Factor | Demand Forecasting | Demand Sensing |
|---|---|---|
| Main goal | Estimate future demand | Refine near-term demand expectations |
| Typical horizon | Weeks, months, or quarters | Days or weeks |
| Main inputs | Historical sales, trends, seasonality | Recent internal and external signals |
| Update frequency | Periodic | Frequent or continuous |
| Typical decisions | Capacity, procurement, financial planning | Inventory, allocation, staffing, promotions |
| Response to changes | Slower | Faster |
Demand forecasting creates the baseline.
Demand sensing adjusts that baseline when current data suggests demand is changing.
Most businesses benefit from using both.
Demand Sensing in Supply Chain Planning
Demand sensing in supply chain operations helps teams respond faster to changes that affect inventory, replenishment, distribution, and capacity.
Traditional supply chain forecasts may be updated on fixed weekly or monthly cycles.
But demand may change between those reviews.
A demand sensing solution can add more recent signals to the planning process.
For example, rising orders, falling inventory, stronger store traffic, or changing market activity may indicate that demand is increasing faster than expected.
Supply chain teams can then respond before the change creates stockouts or service problems.
This makes demand sensing especially useful for short-term planning.
What Data Is Used in Demand Sensing?
The quality of demand sensing technology depends heavily on the data behind it.
Internal Data
Internal data shows what is happening inside the business.
Useful signals include sales, orders, returns, inventory, promotions, pricing, product views, website activity, and supply chain updates.
These signals can show that demand is changing.
However, they may not explain why.
External and Real-World Data
External data adds market context.
Examples include mobility patterns, foot traffic, visit intelligence, POI data, consumer characteristics, economic signals, market activity, and property characteristics.
For example, a store may report falling sales.
External signals may show that activity across the entire trade area has declined, a nearby competitor is gaining traffic, or consumers are shifting toward another commercial district.
Combining both types of data provides a clearer view of demand and its drivers.
Demand Sensing Benefits
Demand sensing benefits come from detecting meaningful changes earlier.
Improved Forecast Accuracy
Historical sales create a useful baseline, but they may miss sudden changes.
Recent signals can help models identify where actual demand is starting to differ from expectations.
Forecast performance can be measured using metrics such as MAPE, WMAPE, MAE, and forecast bias.
Lower Inventory Risk
Poor forecasts can create stockouts in strong markets and excess inventory in weaker ones.
Demand sensing helps teams adjust replenishment and allocation earlier.
This can improve product availability while reducing excess stock and markdown risk.
Faster Response to Market Changes
Traditional forecasts may be updated weekly or monthly.
Demand sensing technology can provide more frequent visibility into changes in sales, visits, competitor activity, and local markets.
Teams can respond without waiting for the next planning cycle.
Better Location-Level Planning
Demand often varies between stores, neighborhoods, and regions.
Demand sensing can combine store performance with foot traffic, visits, local consumers, and market activity.
This helps teams avoid applying the same assumptions across every location.
Better Promotion Planning
Promotions may perform differently by market.
Demand sensing can help teams compare sales, store visits, campaign activity, and local conditions while the promotion is running.
This can support changes to timing, targeting, inventory, or media spend.
Better Operational Alignment
Updated forecasts create a more current view of demand across teams.
Inventory, marketing, staffing, distribution, finance, and operations can work from the same signals.
Demand Sensing Use Cases
Demand sensing use cases vary by industry and business model.
Retail Demand Planning
Retailers can combine sales, foot traffic, visits, competitor activity, and market data to improve store-level forecasts.
Inventory and Replenishment
Demand sensing can show where demand is rising or slowing.
Inventory can then be moved toward locations where it is more likely to be needed.
Promotion Planning
Recent sales, visits, and campaign activity can show how demand changes during a promotion.
Teams can use those signals to adjust stock, targeting, and spend.
Market-Level Forecasting
Businesses can compare mobility, competition, economic conditions, and market activity across regions.
This can help identify areas where demand is strengthening or weakening.
New-Store Forecasting
New locations often have little or no historical sales data.
Businesses can use comparable-store performance, local foot traffic, consumer profiles, and competition to estimate likely demand.
Travel and Hospitality
Travel companies and hotels can use movement, destination visits, and local market signals to detect changes in travel demand.
These insights can support pricing, staffing, capacity, and marketing decisions.
What to Look for in Demand Sensing Solutions
Demand sensing solutions should do more than collect large amounts of data.
They should help teams turn fresh signals into useful forecast updates.
A strong demand sensing solution should support:
- Internal and external data integration
- Frequent data updates
- Store, market, product, or regional analysis
- Forecast-versus-actual measurement
- Leakage-safe model testing
- Integration with planning and operational systems
The right demand sensing technology should fit existing workflows rather than creating another disconnected analytics system.
How to Implement Demand Sensing
Businesses can introduce demand sensing step by step.
1. Define the Decision
Start with a specific business problem.
This may be inventory, staffing, promotions, pricing, or store planning.
2. Create a Baseline
Build or identify the existing forecast using historical sales, seasonality, and trends.
3. Select Relevant Signals
Add only the internal and external signals that have a meaningful relationship with demand.
More data does not automatically mean better forecasting.
4. Standardize the Data
Align data by time, geography, product, store, or market.
Consistent data makes comparisons more reliable.
5. Prevent Data Leakage
Only use information that would have been available at the time of the forecast.
Otherwise, the model may appear more accurate during testing than it would be in real operations.
6. Measure the Improvement
Compare the baseline with the demand sensing model.
Useful metrics include MAPE, WMAPE, MAE, forecast bias, stockout rate, and inventory turnover.
7. Connect Forecasts to Workflows
Updated forecasts should flow into the systems where teams make decisions.
These may include planning software, inventory systems, dashboards, warehouses, APIs, or operational applications.
Conclusion
Demand sensing helps businesses improve short-term forecasts by combining historical demand with recent internal and external signals.
The key concept of demand sensing is simple: when current market conditions begin to differ from historical expectations, forecasts should respond.
Demand sensing in supply chain, retail, logistics, and other fast-moving environments can improve visibility into changes across products, stores, markets, and customer groups.
When implemented well, demand sensing can improve forecast accuracy, reduce inventory risk, and help teams act faster.
FAQs
What Is Demand Sensing?
Demand sensing is a short-term forecasting approach that uses recent internal and external data to detect changes in demand and update existing forecasts.
What Is the Difference Between Demand Sensing and Demand Forecasting?
Demand forecasting creates a baseline using historical patterns and longer-term trends.
Demand sensing updates that baseline using recent signals to improve near-term decisions.
What Are the Main Demand Sensing Benefits?
Demand sensing benefits include improved short-term forecast accuracy, lower inventory risk, faster response to demand changes, better location-level planning, and stronger operational coordination.
What Are Common Demand Sensing Use Cases?
Common demand sensing use cases include inventory planning, replenishment, promotion monitoring, market forecasting, new-store forecasting, staffing, and travel demand planning.
What Should a Demand Sensing Solution Include?
A demand sensing solution should support fresh internal and external data, frequent forecast updates, model monitoring, location or product-level analysis, and integration with operational workflows.