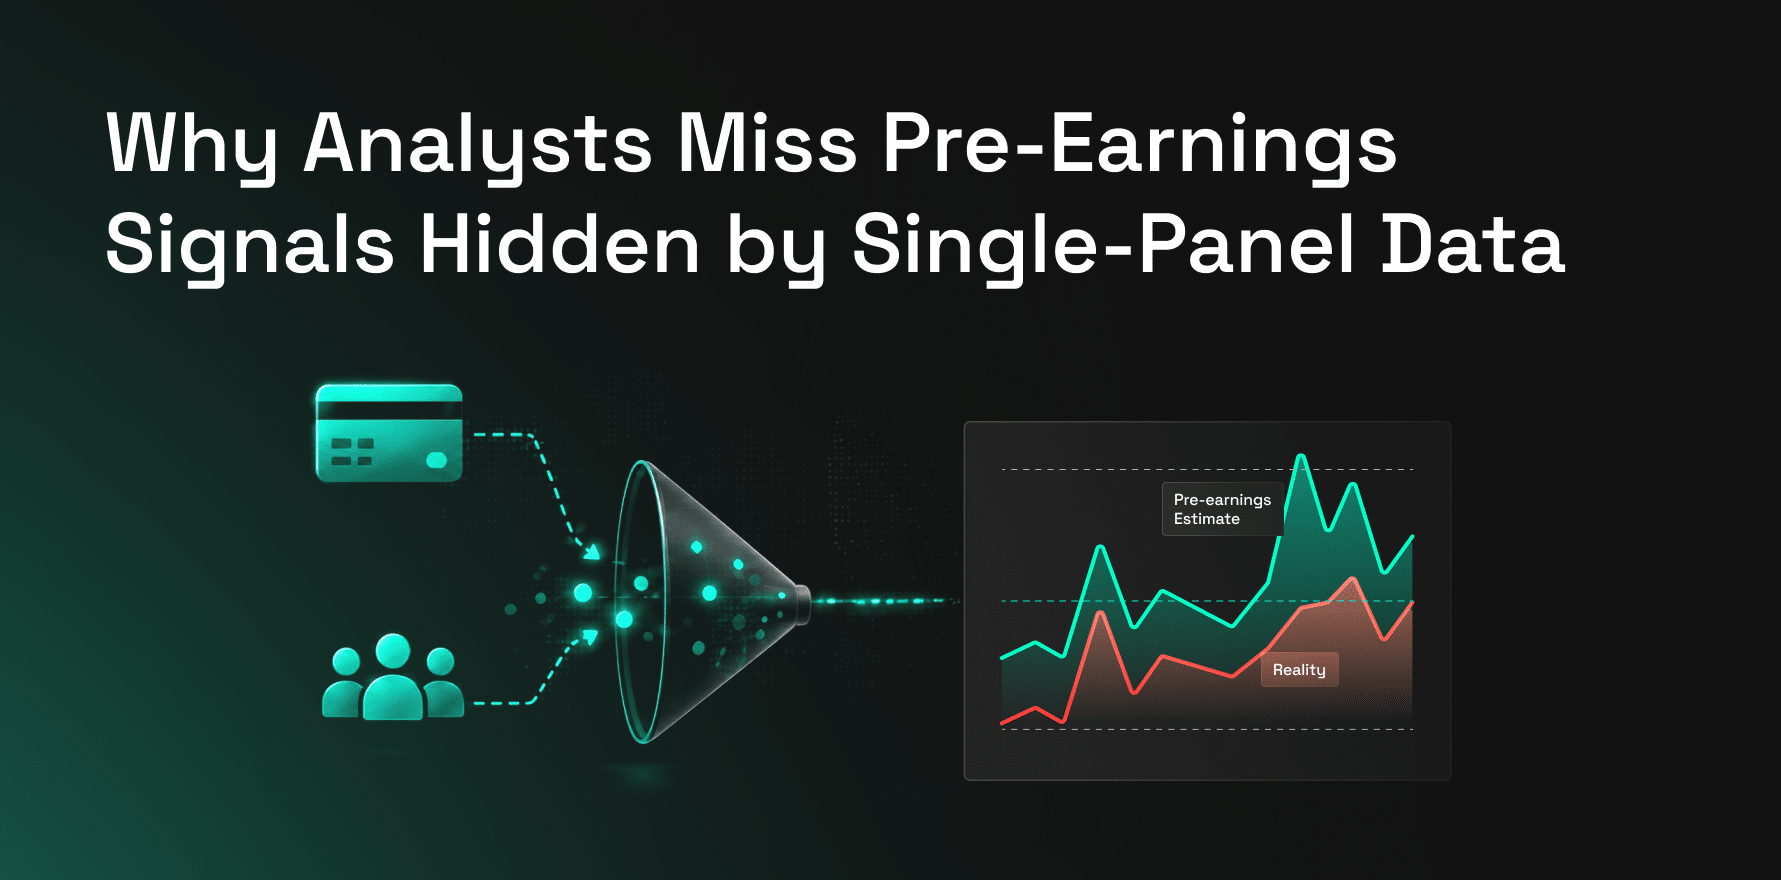
A fund builds its pre-earnings revenue estimate for a national retailer using a card panel that’s covered them reliably for years. The stock misses anyway. Nothing was wrong with the model. The panel just skewed toward one issuer’s cardholders, in one set of regions, and missed a shift happening everywhere else.
This is a more common failure than it looks like from the outside, and it rarely gets traced back to the actual cause: the transaction signal behind the estimate came from one panel, covering one slice of consumers, standing in for the whole picture.
Why Single-Panel Spend Signals Break Down
No card panel sees every transaction. Each one is anchored to a specific issuer, a specific demographic skew, or a specific set of merchant categories where its data-sharing agreements happen to reach. That’s fine for the categories and regions it covers well, and quietly misleading everywhere else.
For an analyst, that means a panel that over-represents certain income brackets, underrepresents cash- and non-card payment shifts, or has thin coverage in the exact region driving a company’s next quarter. Revenue models, same-store sales estimates, and demand forecasts all inherit whatever skew sits inside the panel feeding them, and that skew rarely shows up until an estimate misses.
What Closes the Gap
The fix isn’t a bigger single panel. It’s not depending on one. This is where aggregated spend data does the real work: transaction and behavioral signals pulled from multiple independent panels and sources, cross-checked against each other so no single issuer’s blind spot becomes the analyst’s blind spot.
A few things separate research teams that get this right:
Panel Diversity That Maps to the Company Being Modeled
A large total cardholder count means little if the panel is thin in the exact demographic or region driving that company’s growth. Coverage should be checked against the business being analyzed, not just the panel’s total size.
Recency That’s Been Verified, Not Just Advertised
Spend behavior shifts fast around promotions, seasonality, and category disruption. What matters is whether a panel reflects last week’s behavior, not last quarter’s.
Cross-Checked Signals
When multiple independent sources agree on a directional trend, confidence goes up. When they diverge, that’s exactly where the real signal, or the real risk, is hiding.
Category and Geographic Breadth
A panel strong in card-present retail but blind to e-commerce, subscriptions, or cash-adjacent categories will misread any company whose growth lives outside its coverage.
Consistency Across the Names in a Portfolio
A source that’s reliable for one retailer and thin for another quietly caps how much an analyst can trust the same methodology across a full coverage list.
Why This Matters More Before Earnings Than Almost Anywhere Else
Alternative data lives or dies on timing. A revenue estimate built on aggregated spend data that’s cross-validated across sources catches shifts a single panel misses, a regional slowdown, a category shift, a competitor gaining share, days or weeks before it shows up in a single-panel view.
In investment research, that gap isn’t academic. It’s the difference between being positioned ahead of an earnings surprise and being caught by one.
Firms that rely on one panel because it’s convenient or familiar are making the same trade retailers make when they trust one location feed: confidence that isn’t earned, in exchange for coverage that isn’t complete.
How Factori Helps
Factori’s Real World Graph combines consumer behavior signals with mobility, places, and property data, helping research teams validate directional spend trends against what is happening in the physical world.
Teams can access these signals through REST API, direct data delivery, or MCP-based workflows. Coverage should be evaluated against the specific companies, categories, and geographies in a research universe before use in a live process.
Conclusion
Alternative data is only as useful as the coverage behind it. When a single panel represents only one slice of consumer behavior, the resulting blind spots can flow directly into revenue estimates, same-store sales models, and pre-earnings forecasts.
Aggregated spend data gives analysts a broader signal by comparing multiple sources instead of treating one panel as the full market. Before earnings, that additional context can help research teams identify shifts that would otherwise remain hidden until results are reported.
FAQs
Why Is Aggregated Spend Data Important for Investment Research?
Revenue estimates and demand models can inherit the demographic, geographic, and category biases of the transaction panels feeding them. Aggregated spend data helps reduce dependence on any one panel by bringing together multiple signals, giving analysts a broader view of consumer behavior before earnings.
How Can an Analyst Tell If Their Current Panel Has Blind Spots?
Compare panel-implied trends against a name where the real outcome is already known and check for systematic misses. A panel that consistently overshoots or undershoots for certain regions or categories is signaling its own coverage gap.
Does This Only Matter for Large-Cap Consumer Names?
No. Smaller and mid-cap names are often more exposed, since panels tend to concentrate coverage in the largest, most card-heavy retailers and thin out elsewhere.
Is This Relevant to Systematic or Quant Strategies, Not Just Fundamental Research?
Increasingly, yes. Systematic strategies built on spend signals are only as reliable as the panel behind them. A skewed input produces a skewed factor, regardless of how sound the model built on top of it is.