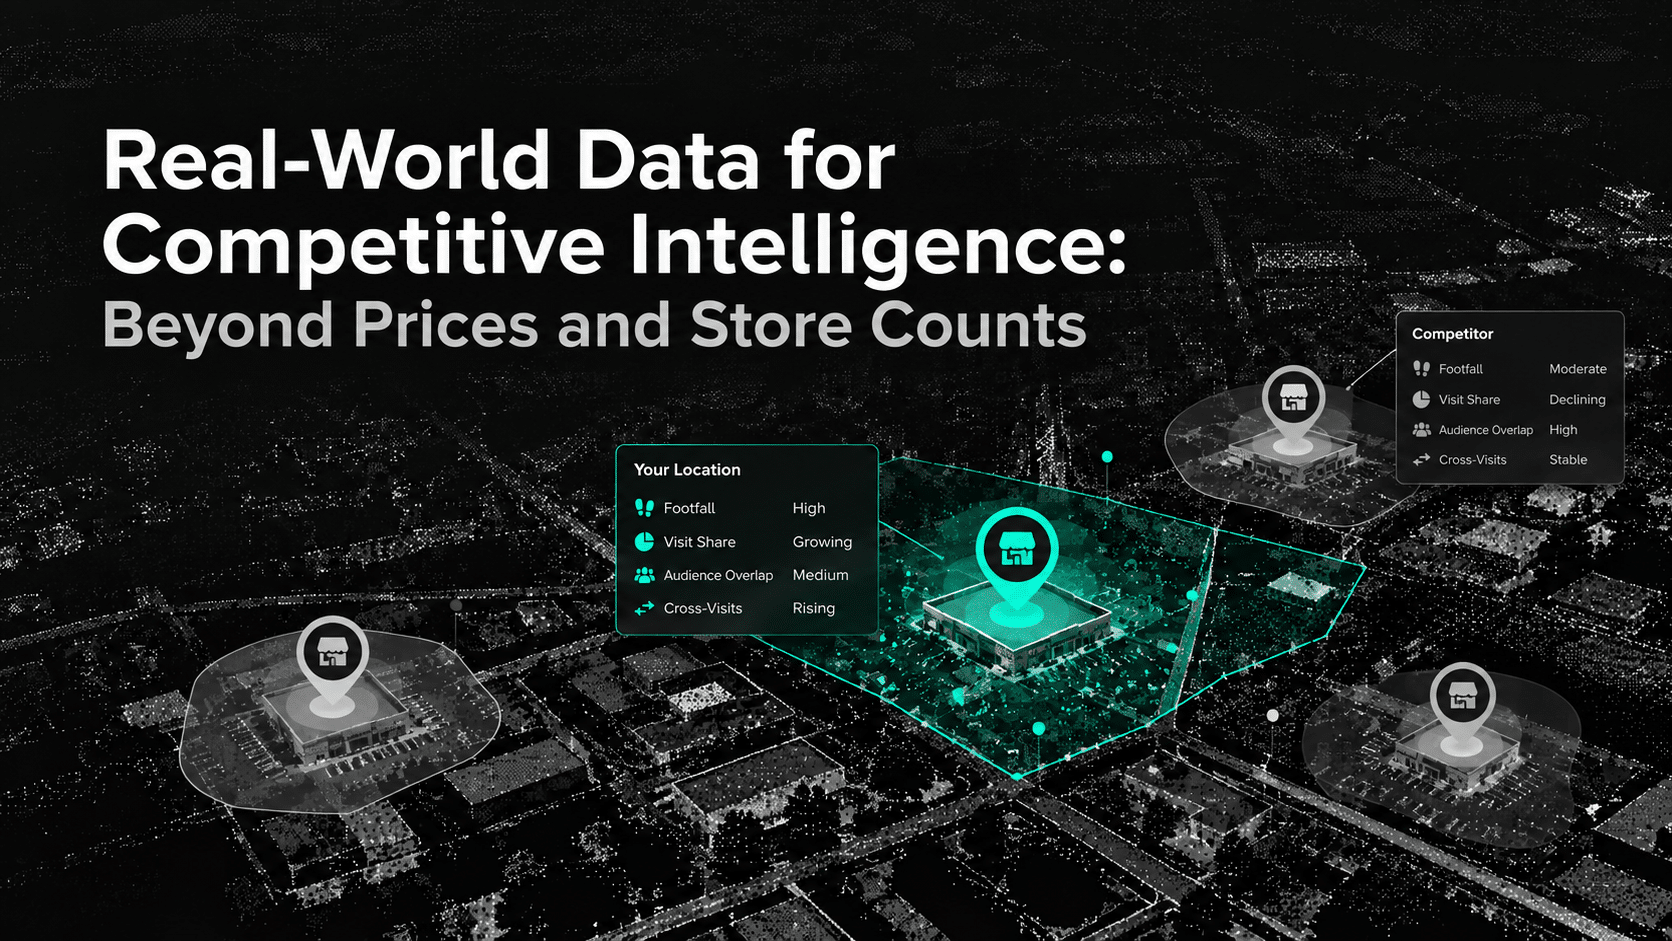
Competitive intelligence products often start with data that is easy to collect: prices, promotions, product catalogs, business listings, and store counts. These inputs are useful, but they mostly describe what companies are doing rather than how the physical market is responding.
For adtech platforms, data brokers, AI companies, and analytics providers, that creates a product gap. Real-world data can add behavioral and geographic signals such as visitation, trade areas, movement patterns, POI change, and market activity that can be licensed, modeled, and embedded into downstream intelligence products.
Key Takeaway
- Prices, promotions, and POI counts describe competitor activity but do not fully capture physical-market response.
- Mobility and visitation data can add behavioral signals to competitive intelligence products, but these signals must be normalized and interpreted carefully.
- Data buyers should evaluate real-world datasets on coverage, consistency, joinability, update cadence, methodology, and licensing rights, not only scale.
- POI, mobility, market, audience, and economic data become more valuable when they can be joined into a consistent external-data layer.
- The strongest suppliers are those that make real-world data easier to integrate into products, models, APIs, client analytics, and AI workflows.
Competitive Intelligence Products Have a Physical-World Data Gap
Many competitive intelligence products are strongest where collection is straightforward. Prices can be scraped, product catalogs monitored, promotions tracked, and store addresses collected from public or commercial sources.
That creates good visibility into competitor activity. It does not necessarily show whether that activity changed consumer movement, destination strength, local market dynamics, or visitation patterns.
For a data company, this is less a retail-analysis problem than a product coverage problem. If customers increasingly ask which locations are gaining activity, where trade areas overlap, or whether a competitor is strengthening within a market, prices and store counts alone may not support the answer.
Real-world data adds another class of signal that can be incorporated into those products.
Move From Competitor Presence to Behavioral Signals
POI data can answer where a business operates, which category it belongs to, and how its physical footprint changes over time. Mobility data and visitation data can add evidence about how activity around those places changes.
That creates additional features a competitive intelligence provider can build, such as:
- visitation trends by location or brand
- visitor-origin distributions
- trade-area size and overlap
- changes in destination pull
- cross-visitation between locations
- daypart and weekday patterns
- category or market-level movement
These are not substitutes for revenue, transaction, or first-party customer data. They are external behavioral signals that can expand the questions a downstream product is able to answer.
The product-design question is therefore not whether foot traffic “proves” competitor performance. It is whether the signal adds enough incremental information to improve a model, benchmark, ranking, forecast, or client-facing insight.
Store Counts Are Easy to License. Competitive Strength Is Harder to Model
A POI database can show that two brands each operate ten stores in a market. That does not mean the two networks have the same physical-market influence.
One brand may operate smaller neighborhood locations with highly local catchments. Another may have fewer but stronger destinations drawing activity from a much larger area. A location-count feature treats these structures similarly even though the underlying behavior is different.
This is where POI and mobility data become more valuable together. POI provides the entity layer: stores, brands, categories, coordinates, status, and surrounding places. Mobility provides a behavioral layer that can be used to derive visitation, origin, overlap, and market-movement features.
For a data buyer, the value is not simply access to both datasets. The larger question is whether they can be joined consistently enough to become production features.
Trade Areas Can Become a Derived Competitive Feature
Fixed-radius proximity is easy to calculate, which is why it appears in many location products. But straight-line distance does not account for roads, physical barriers, destination strength, commuting behavior, or actual visitor origins.
Observed or modeled trade areas provide a different input. Two nearby businesses may serve largely separate populations, while two more distant locations may attract visitors from many of the same origins.
For an intelligence provider, this can support features such as:
- market overlap scores
- competitive exposure
- destination strength
- catchment similarity
- geographic whitespace
- network cannibalization risk
The important distinction is that these are derived indicators, not ground truth. Their quality depends on the underlying mobility sample, visit methodology, geographic coverage, normalization, and the model used to construct the trade area.
Time-Series Data Matters More Than a Snapshot
A static POI layer tells a system which businesses exist now. Many higher-value use cases require understanding what changed.
A competitive intelligence product may need to detect whether visitation rose after a store opening, whether activity shifted following a relocation, or whether a brand’s trade area expanded over several months. That requires a stable time series rather than a one-off location snapshot.
Useful derived signals can include:
| Signal | Potential product interpretation |
|---|---|
| Rising normalized visits | Increasing activity around a location |
| Falling normalized visits | Potential weakening or temporary disruption |
| Expanding trade area | Increasing destination pull |
| Increasing overlap | Greater exposure to the same geographic market |
| New visitor origins | Expansion into new origin markets |
| Daypart change | Shift in when a location attracts activity |
| POI change nearby | Change in the surrounding physical-market context |
None of these signals explains causation independently. Seasonality, events, road changes, promotions, nearby openings, panel changes, and broader market growth can all affect the result.
For product teams, this means the dataset must support contextual baselines, not only raw movement counts.
Market Baselines Help Prevent Misleading Signals
Suppose visitation to a location rises 10%. That may look like positive competitive momentum until the broader category is shown to have grown 20% over the same period.
A useful competitive intelligence feature should therefore distinguish absolute movement from relative movement. This may require market-level or category-level baselines that allow the downstream model to compare a specific location with the environment around it.
For data buyers, that raises an important sourcing question: can one supplier provide enough contextual data to build those baselines, or will several datasets need to be normalized and joined internally?
The answer directly affects engineering effort, time to production, and the reliability of the resulting feature.
Cross-Visitation Can Improve Competitor Definitions
Competitive sets are usually built from categories, brands, or geography. Those rules are useful, but they do not always reflect actual behavioral overlap.
Cross-visitation signals can help show which places share visitors and which locations may be complementary rather than directly competitive. That can support better competitor graphs, audience-overlap features, recommendation systems, market maps, and location-ranking models.
For adtech and audience products, similar signals may help create contextual or aggregated audience features around places and categories. Audience segmentation becomes more useful when it combines first-party context with broader geographic, POI, mobility, and market signals.
These outputs should remain aggregated and privacy-safe, with transparent methodology and clear controls around sensitive-place handling. This matters because the FTC treats precise geolocation as highly sensitive and has taken enforcement action involving its misuse.
The Real Evaluation Is Whether the Data Can Become a Product Input
A dataset can be analytically interesting and still be difficult to commercialize.
For a Head of Data Partnerships, founder-CTO, or data product leader, the evaluation needs to go beyond whether the data looks useful in a demo. The real question is whether it can become a reliable supply input.
That means evaluating areas such as:
- Coverage: Does the dataset perform consistently across the markets your customers use?
- Freshness: Can updates support the cadence promised by your product?
- Joinability: Are POIs, visits, markets, and other datasets easy to connect?
- Historical stability: Can models compare periods without unexplained structural breaks?
- Methodology: Are modeled, inferred, and observed fields clearly documented?
- Normalization: Can markets or time periods be compared without confusing panel changes with real-world change?
- Licensing: Can derived features, APIs, client reports, AI outputs, or downstream products use the data as intended?
- Delivery: Can the supplier deliver through the cloud, files, APIs, or warehouse environments already used by your stack?
- Privacy: Is the data aggregated, privacy-safe, transparently sourced, and appropriate for downstream enterprise use?
These checks become even more important when external data feeds AI systems. NIST’s AI Risk Management Framework emphasizes trustworthiness characteristics such as validity, reliability, transparency, explainability, and privacy across the AI lifecycle.
Third-party data should also be treated as a governance dependency rather than a passive input. NIST specifically notes that organizations may need governance around external data and other third-party components used in AI products and services.
This is where supplier quality becomes part of product quality.
Build Competitive Intelligence From Multiple Evidence Layers
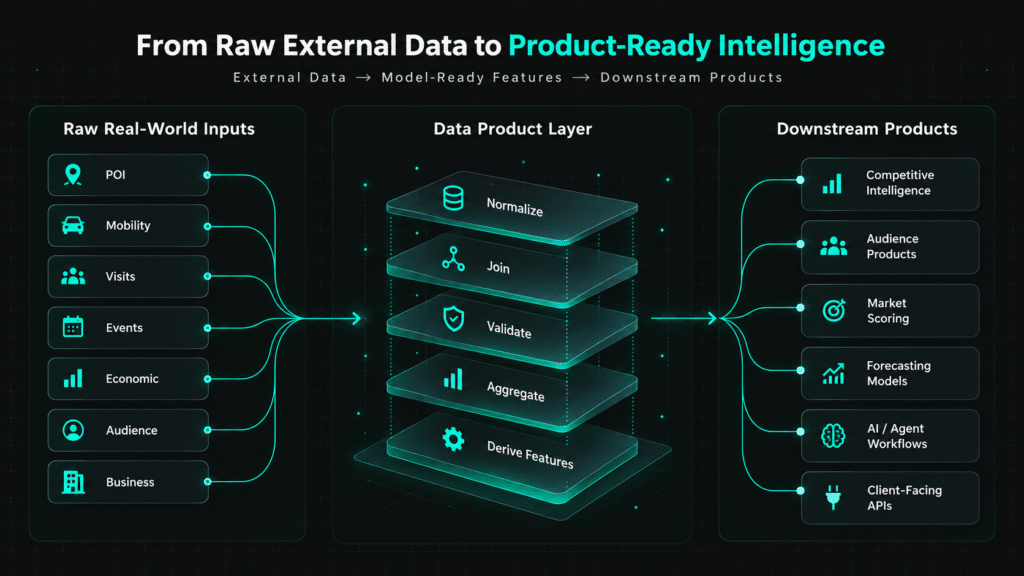
A stronger competitive intelligence product combines different classes of external signals rather than expecting one dataset to answer everything.
Competitor-controlled signals such as prices, promotions, product assortment, and store openings describe what a company is doing. Physical-market signals such as POI changes, visitation, trade areas, and movement help describe how activity around those businesses is changing.
Market signals such as events, economic conditions, business activity, demographics, and category movement add context around those changes. A downstream customer can then combine these external signals with its own transactions, CRM, sales, media, or operational data.
For the data company supplying the product, the goal is not to accumulate the most datasets. It is to create reliable features that are easy to join, explain, and operationalize. This is also why location intelligence becomes more useful when POI, mobility, visit, demographic, business, and market signals can be analyzed together.
Where Factori Fits
Factori provides real-world data that data platforms, adtech companies, AI products, analytics providers, and other enterprises can use as an external supply layer.
Its data products include Places, Mobility, Visits, People, Audience, Market, Economic, Business, Events, Geo, and other real-world signals. These datasets can be used individually or combined to build location features, competitive indicators, audience products, market intelligence, forecasting inputs, and other downstream data products.
The value for a data buyer is in the delivery and combination layer. Factori supports APIs, cloud delivery, files, the Factori Platform, and AI workflows, allowing real-world signals to feed existing products and infrastructure rather than remain confined to a standalone dashboard.
Aggregated, privacy-safe mobility and visitation data can add behavioral context, while POI and other market datasets provide the entity and environmental layers needed to build broader competitive intelligence features.
Conclusion
Competitive intelligence becomes more differentiated when products can move beyond what competitors publish and incorporate signals about how the physical market is changing.
For data buyers, the key question is not simply whether a provider offers POI, mobility, or visitation data. It is whether those datasets are consistent, joinable, well-documented, privacy-safe, and commercially usable enough to become reliable inputs into the products their customers depend on.
FAQs
What real-world data is useful for competitive intelligence products?
Common inputs include POI, mobility, visitation, trade areas, market activity, events, demographic context, economic data, and business data. The right combination depends on the downstream product and the decisions it needs to support.
How should data buyers evaluate mobility data?
Evaluate geographic coverage, observation density, visit methodology, normalization, historical consistency, update cadence, and how modeled or inferred metrics are generated. Buyers should also test whether the data performs consistently across the markets used by their customers.
Why combine POI and mobility data?
POI data identifies places, brands, categories, and locations. Mobility data adds behavioral context around those places, allowing product teams to derive features such as visitation trends, trade areas, overlap, and destination strength.
What matters when licensing real-world data for downstream products?
Licensing rights, delivery methods, update frequency, geographic coverage, stable identifiers, data lineage, methodology, privacy controls, and rights to create derived outputs all matter. The dataset must fit both the technical architecture and the commercial model.
Can real-world data be used in AI products?
Yes, when licensing and architecture support the intended use. Real-world data can provide location, market, movement, and business context to AI applications, retrieval systems, analytical agents, and forecasting models. For AI deployments, governance and validation should also reflect the system’s context of use and the risks associated with third-party data.