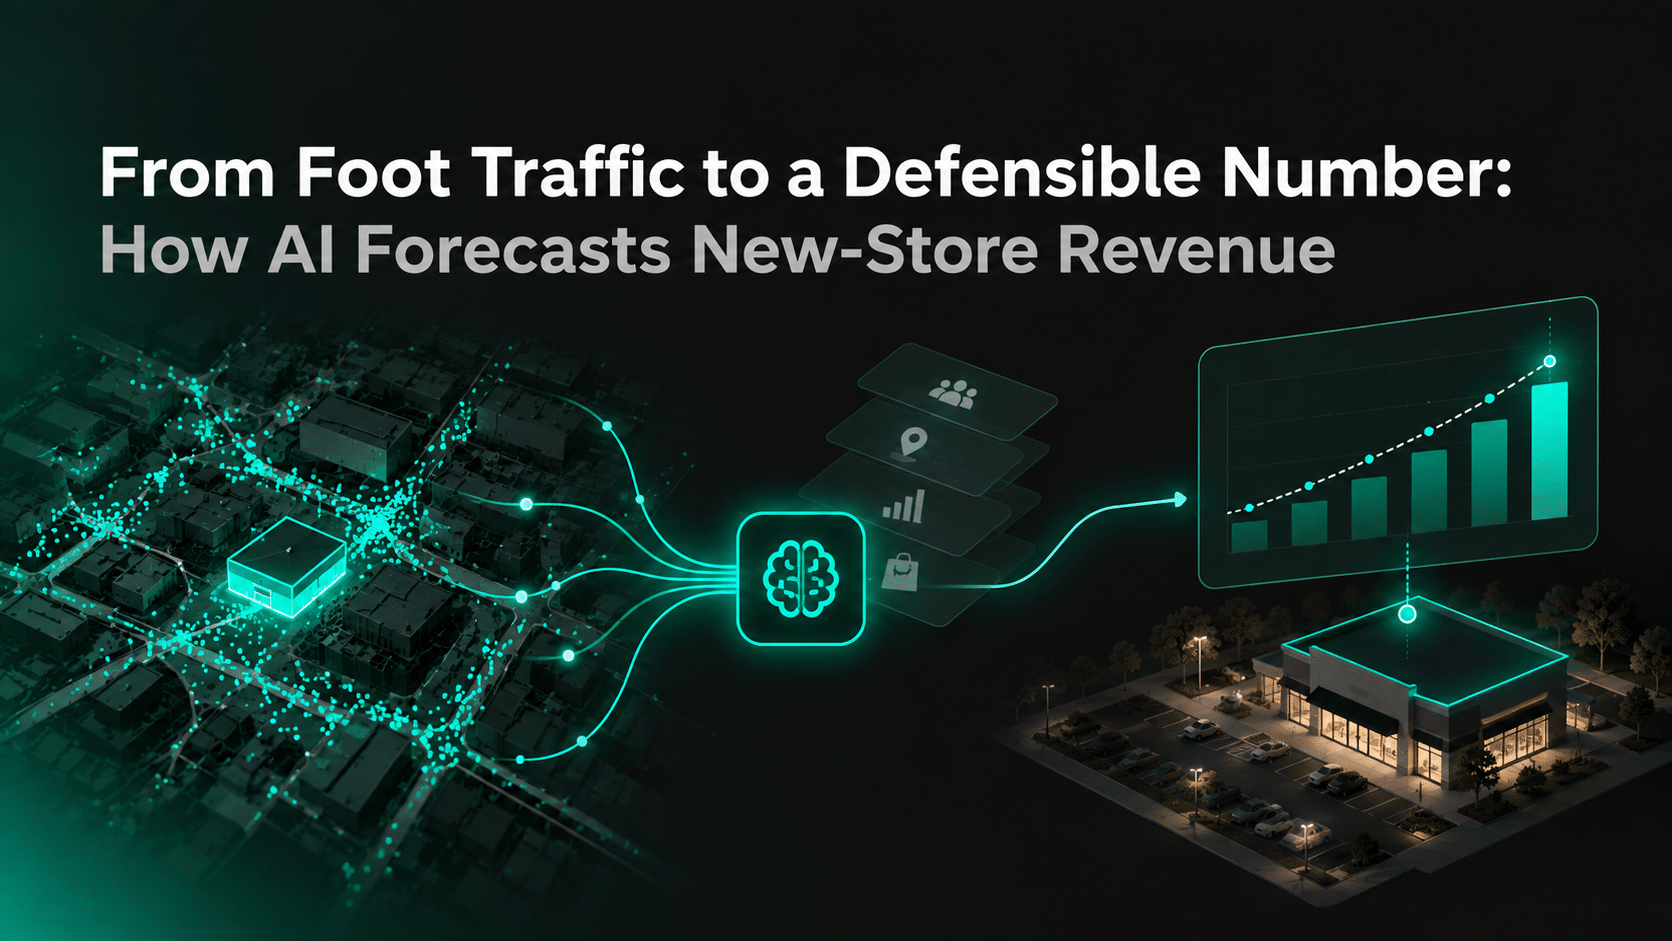
Every new-store revenue forecast eventually reaches someone who did not build the model. It may be a CFO, investment committee, franchisor, or expansion leader, and they need more than a final number before approving a long-term location decision.
Their question is usually not just, “What is the forecast?” It is, “What is this number based on, and how much confidence should we place in it?” A useful AI forecast therefore needs clear inputs, comparable evidence, model validation, and enough transparency for decision-makers to understand what is driving the result.
Key Takeaway
- AI revenue forecasting is more useful when decision-makers can see the data, drivers, and assumptions behind the estimate.
- Demographic data explains market structure, while mobility and visitation data add current behavioral context.
- Observed trade areas can reveal customer reach that fixed-radius models may miss.
- Comparable-store analysis should rely on locations with similar trade-area, visitor, competitive, and operating patterns.
- AI can identify nonlinear relationships and interactions across multiple signals, but every input still needs validation.
- Forecast drivers such as dwell time, POI mix, competition, and cannibalization should be treated as hypotheses until they prove predictive value.
- Models should be tested on stores or markets they were not trained on, not just evaluated on historical fit.
- A richer model should outperform a simpler baseline before the added complexity is justified.
- Forecast ranges are more credible than overly precise single-number estimates because they reflect uncertainty.
- Observed and modeled inputs can both be useful, but teams should know which is which and how much each influences the final forecast.
Start With What the Market Is Actually Doing
Most site evaluations begin with structural market data such as population, household composition, employment, income bands, or other demographic indicators. Sources such as the U.S. Census Bureau’s American Community Survey provide demographic, social, economic, and housing context that can help teams understand the structure of a market.
Those inputs are useful, but they do not show everything happening in that market today. Aggregated and anonymized mobility data can add a more current behavioral layer by showing how groups of people move through an area, when activity peaks, which destinations attract visits, and how that activity compares with nearby locations.
This is where foot traffic analytics becomes useful. Demographics describe the structure of a market, while mobility and visitation signals add evidence about how that market is currently behaving. Neither should automatically replace the other.
Build the Trade Area From Observed Behavior
A fixed-radius trade area can be useful as a simple starting point, but it assumes distance is the main factor determining customer reach. Real markets are rarely that simple.
Trade-area shape can be influenced by:
- highways, rivers, and physical barriers
- transit access and commuting patterns
- nearby competitors
- strong retail or entertainment anchors
- destination strength
- differences in how far customers are willing to travel
An observed trade area analysis takes a different approach. Instead of drawing the boundary first, it looks at aggregated visitor-origin patterns around comparable stores or destinations and uses those patterns to understand the shape of actual market activity.
That trade area may be smaller than a radius would suggest because a road, transit barrier, or competitor limits movement. It may also extend much farther because a strong destination attracts visitors from outside the immediate neighborhood.
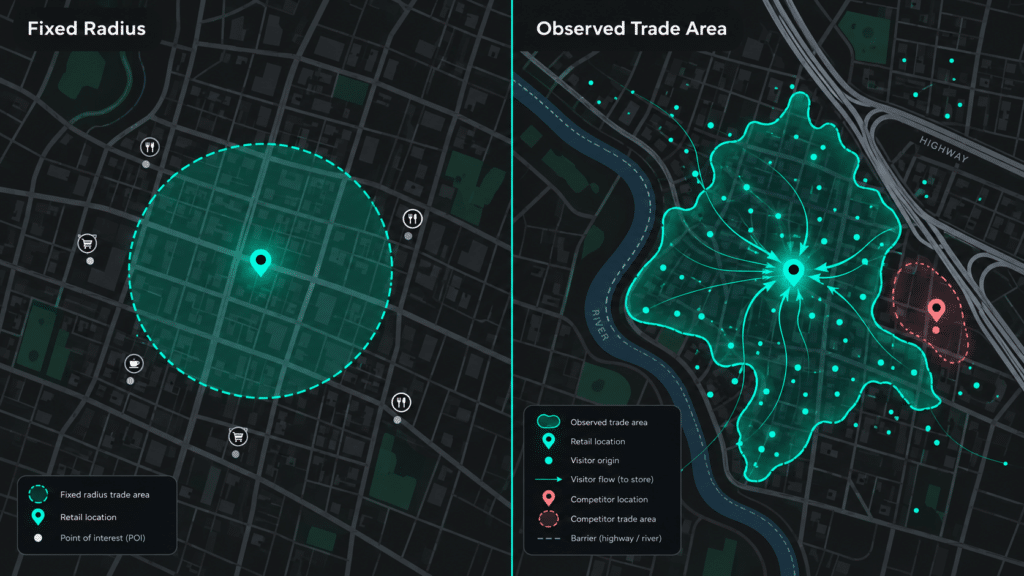
Observed trade areas are not perfect ground truth. Their reliability depends on sample quality, aggregation level, observation period, and how sparse areas are handled, but they can provide a more behavior-led starting point than distance alone.
Compare the Candidate With Stores You Already Understand
Once the trade area is defined, the next question should not simply be what an average store in the industry earns. A more useful comparison is which existing locations most closely resemble the candidate and what happened at those stores.
Comparable stores can be evaluated using visitor patterns, trade-area characteristics, competitive density, nearby business mix, store format, and other market signals. These same inputs can support a broader retail location strategy when teams need to compare candidate sites beyond revenue alone.
AI can help by comparing many variables at once and identifying stores that may not look similar on one metric but behave similarly across several dimensions. The quality of the comparison still depends on the inputs, though. A more sophisticated model cannot compensate for stale, inconsistent, or weak source data.
What AI Adds Beyond a Traditional Forecast
AI becomes useful when the relationships between variables are too complex for fixed rules. High foot traffic alone, for example, may not predict strong store performance, but high traffic combined with the right visitor mix, competitive environment, neighboring categories, and trade-area characteristics may be more informative.
Depending on the model, AI can help with:
- identifying nonlinear relationships between variables
- comparing many candidate sites and comparable stores at once
- finding interactions between mobility, POI, demographic, and competitive signals
- estimating which features contribute most to the prediction
- recalibrating as additional store outcomes become available
That does not mean every available field belongs in the model. A variable should remain because it improves performance on data the model has not already seen, not because the variable sounds intuitively useful.
Make the Forecast Show What Is Driving It
A single revenue estimate gives a decision-maker very little to examine. A more useful forecast explains which factors influenced the estimate, whether they pushed it higher or lower, and what evidence supports each relationship.
| Driver | Possible effect | What it is based on | What should be validated |
| Trade-area similarity to high-performing stores | Positive | Aggregated visitor origins and comparable-store patterns | Whether similar trade areas consistently produce similar revenue |
| Nearby POI and category mix | Positive or negative | POI density, brand presence, surrounding categories | Whether the mix adds predictive value for this brand |
| Visit timing and activity patterns | Positive or negative | Aggregated visitation by day and time | Whether activity aligns with the store’s operating model |
| Dwell patterns | Contextual | Aggregated visit duration around relevant destinations | Whether longer activity correlates with store performance |
| Anchor and co-tenancy mix | Positive or negative | Nearby brands and complementary businesses | Whether those neighbors are associated with stronger demand |
| Competitive overlap | Negative or mixed | Competitor presence and overlapping trade areas | Whether competition reduces demand or confirms category strength |
| Cannibalization exposure | Negative | Overlap with existing store trade areas | How much projected demand could shift from existing stores |
These should be treated as candidate drivers rather than universal truths. Longer dwell time may indicate stronger engagement with an area, but it does not automatically prove higher purchase intent. A dense competitive market may reduce available demand in one context and confirm strong category demand in another.
The model therefore needs to prove which relationships actually matter for the brand and format being analyzed. That also applies to retail store cannibalization, where trade-area overlap should be tested against actual store behavior rather than assumed to represent lost demand.
Validate the Model on Stores It Has Not Seen
A forecast becomes more credible when it performs well outside the data used to build it. Instead of reporting only how closely the model fits historical stores, teams should test it on stores, markets, or time periods that were held out during model development.
A useful validation process should check:
- how far predicted revenue was from actual outcomes
- whether error changes by market, format, or store type
- whether performance weakens when there are fewer comparable stores
- whether mobility, POI, competitive, or trade-area signals improve the result
- whether the model still performs on stores it did not train on
A practical comparison is to test a baseline built from demographics and historical comparable-store performance against a challenger that adds real-world market signals. Metrics such as MAE, MAPE, or RMSE can help measure error, but the main question is whether the richer model performs better on unseen outcomes.
For a broader approach to testing and evaluating AI systems, the NIST AI Risk Management Framework provides guidance around reliability, transparency, explainability, and evaluation. In a revenue-forecasting context, that means a model should not only generate an output but also provide enough evidence to test whether its predictions remain reliable outside the data used to build it.
If the challenger does not reduce error or improve calibration, the extra complexity has not earned its place in the forecasting process.
Use a Range Instead of Pretending the Number Is Exact
A revenue forecast is still a modeled projection, even when it uses strong observed inputs. Presenting one highly precise dollar figure can suggest a level of certainty the model does not actually have.
A forecast range can reflect differences in:
- the number and quality of comparable stores
- market stability
- data coverage
- historical model error
- how unusual the candidate site is
- whether the concept is entering a new market or format
A location with many strong comparables may justify a narrower range. A new format entering a market with little relevant history should probably carry more uncertainty.
Learn From Every Store That Opens
The forecasting process should not stop when the lease is signed. Every new opening creates another opportunity to compare forecasted performance with what actually happened and to understand which drivers held up.
Teams should monitor:
- forecast versus actual revenue
- which drivers consistently over- or under-predict performance
- whether error is concentrated in certain markets or formats
- whether relationships change over time
- whether new signals improve future retraining
If certain variables looked predictive during development but repeatedly fail after launch, they should be reconsidered. New stores can also reveal relationships that the original training data did not capture, which gives teams new evidence to test during retraining.
This feedback loop is what turns AI forecasting into a learning system rather than a one-time site-scoring exercise.
Keep Observed and Modeled Inputs Distinct
A strong forecasting model can use both observed and modeled data, but those inputs should not be treated as equivalent. Observed signals may include measured visits, aggregated visitor origins, POI data, or other recorded market activity, while modeled inputs may include demographic estimates, derived audience characteristics, or calculated demand indicators.
Modeled data is not inherently weak, and observed data is not automatically perfect. Mobility data can still contain sampling limitations, while modeled demographic data can remain highly useful for understanding structural market characteristics.
The important requirement is transparency. Decision-makers should know which inputs are observed, which are estimated or modeled, how frequently they are updated, and how much they influence the result.
Where Real-World Data Fits
Factori provides aggregated, anonymized, privacy-safe real-world signals such as mobility, visitation, and POI data that can add current behavioral and market context to demographic, store-performance, and other enterprise data.
These signals can support trade-area analysis, comparable-store matching, competitive analysis, and other inputs used inside forecasting models. Factori does not replace the forecasting model or the judgment of the expansion team. It adds a location intelligence layer that teams can test against their own store outcomes through APIs, cloud delivery, and other data workflows.
Conclusion
An AI revenue forecast should do more than produce a convincing number. It should show what data informed the result, which factors drove the estimate, how uncertainty was handled, and how the model performed on locations it had not already seen.
Observed mobility and POI signals can strengthen the picture of how a market behaves, while demographic and modeled inputs can add structural context. The strongest forecast is not the one with the most data or the most complex model, but the one that can demonstrate that its inputs improve predictive performance and give decision-makers enough evidence to challenge the result before committing to a long-term location decision.
FAQs
What makes an AI revenue forecast explainable?
An explainable forecast shows the main factors influencing the prediction and how those factors affect the estimate. It should also make clear which inputs are observed, estimated, or modeled so decision-makers can understand what the output is based on.
How should a new-store revenue forecast be validated?
The model should be tested on stores, markets, or time periods that were not used during training. Teams should compare predicted revenue with actual outcomes and test whether additional signals such as mobility or POI data improve performance beyond a simpler baseline.
Why use a forecast range instead of one revenue number?
A range communicates uncertainty that a single precise number can hide. Forecast confidence can vary depending on historical data, the quality of comparable stores, market stability, and how unusual the candidate site is.
What is the difference between observed and modeled inputs?
Observed inputs capture measured activity such as visits, visitor origins, or POI presence, while modeled inputs are estimated or derived from other data. Both can be useful, but they should be labeled and validated separately rather than treated as equally certain.