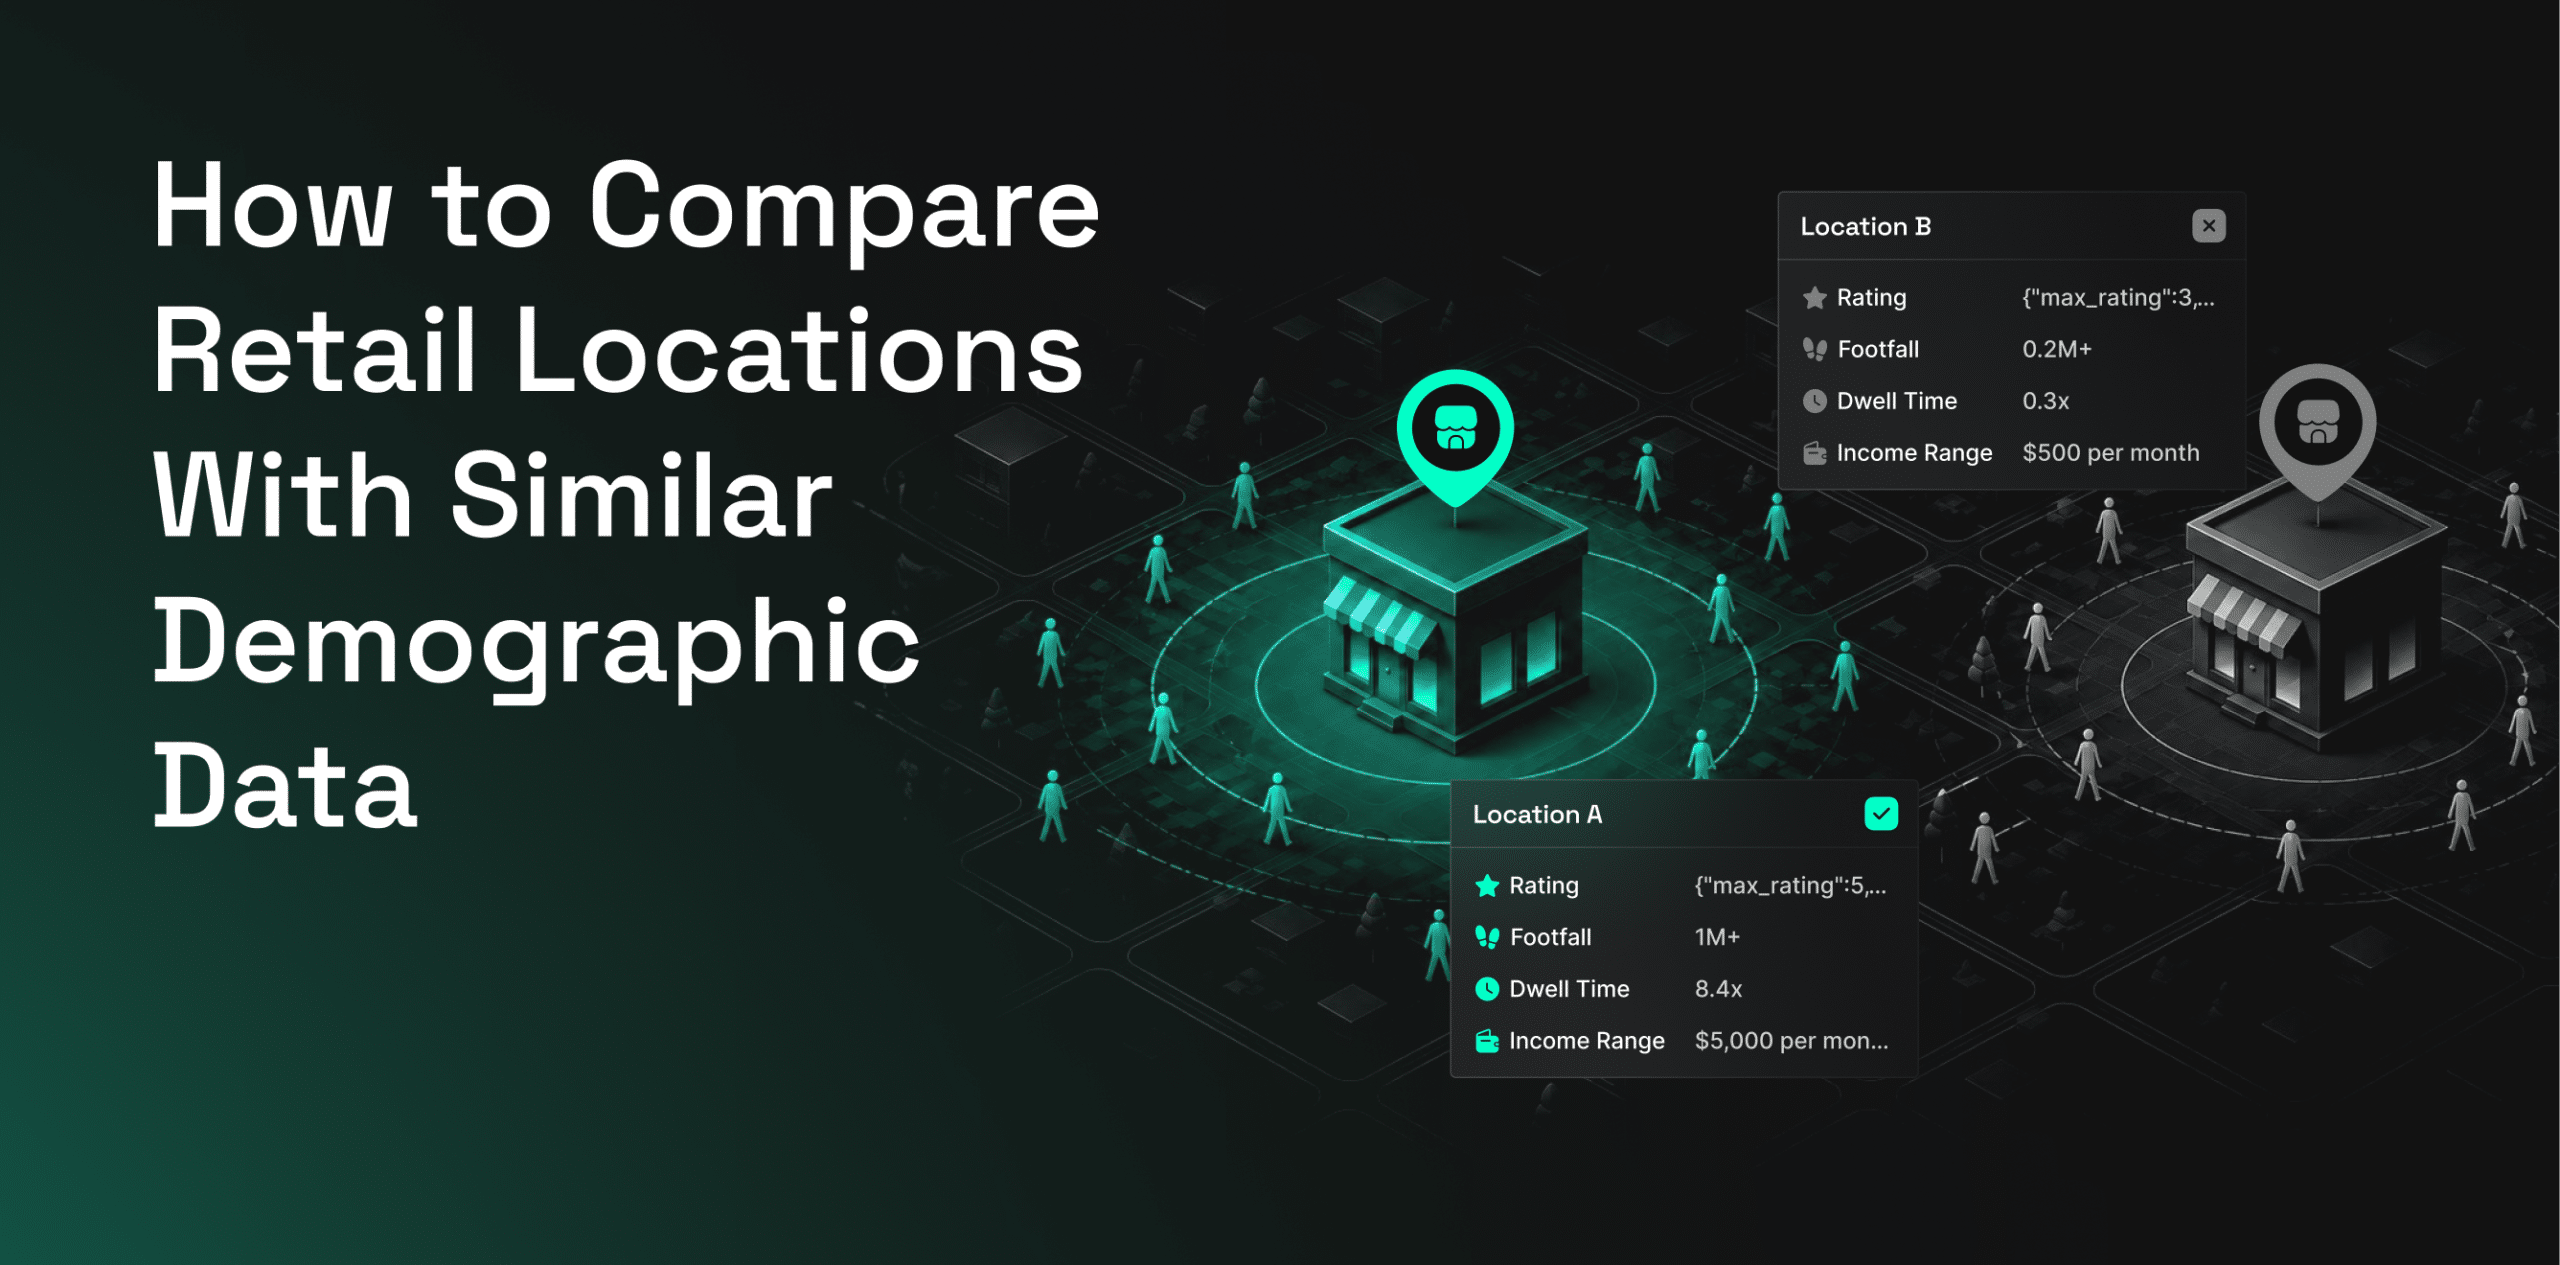
Two retail sites can have similar population sizes, household incomes, age groups, and household profiles.
Based on demographics alone, both locations may appear equally strong.
But demographic data only shows who lives in or around an area. It does not show who actually visits, where people come from, how often they return, or whether a new store will create additional demand.
To compare retail locations properly, retailers need to look beyond demographics. Foot traffic, visitor origins, trade areas, competition, accessibility, and customer movement can reveal important differences between two sites.
Why Similar Demographics Do Not Mean Equal Retail Demand
Demographic analysis is a useful first step in retail site selection.
It helps retailers identify areas where the resident population broadly matches their target customer profile.
However, two sites with similar population, income, age, and household characteristics can still perform very differently.
One site may sit near a busy commuter route and attract steady weekday demand. Another may depend mainly on nearby residents and see most activity during evenings or weekends.
Demographic data alone cannot show:
- How many people actually visit the area
- Whether those visitors match the target customer
- Where visitors travel from
- How often they return
- When visits happen
- Which competing or complementary places they visit
- Whether demand overlaps with an existing store
The strongest retail site is not always the one with the largest or most affluent nearby population.
It is the one with the most relevant, accessible, and incremental demand.
Seven Signals to Compare Retail Sites
When demographics do not clearly separate two sites, retailers should compare the following signals.
1. Relevant Foot Traffic
Start by comparing how many people visit or move through each location.
Total foot traffic gives a sense of overall activity, but visitor volume alone should not decide the site.
A location near a train station or major road may record high movement without generating meaningful retail visits.
Retailers should look at when activity happens, including weekday and weekend patterns, time of day, seasonal changes, and repeat visits.
The stronger site is usually the one where visitor activity matches the store’s operating hours, customer profile, and buying occasions.
2. Visitor and Customer Fit
High foot traffic is only useful if the visitors are relevant to the retail concept.
Retailers should assess whether the people visiting each site match their most valuable customer groups.
Useful characteristics may include household type, purchasing power, lifestyle signals, and observed interests.
For example, two areas may have similar household incomes. But one site may attract office workers during the week, while the other draws families mainly on weekends.
The better site depends on which audience is more likely to engage with the store and make a purchase.
3. Movement-Based Trade Areas
Fixed-radius analysis assumes that people living the same distance from a site have a similar chance of visiting it.
In reality, customer movement is shaped by road access, public transport, physical barriers, nearby destinations, and travel habits.
A movement-based trade area shows where actual visitors to a site or comparable store come from.
Retailers should compare the geographic reach of each location, common visitor origins, travel times, weekday and weekend catchments, and how concentrated demand is around the site.
A wider trade area may suggest stronger destination appeal. A smaller but denser area may support more frequent convenience-led visits.
4. Competitive Environment
Competitors can signal both opportunity and pressure.
Several competitors nearby may show that customers already travel to the area for the category. But too much competition may make it harder for a new store to capture enough demand.
Retailers should look at competitor count, distance, foot traffic, visitor overlap, and changes in competitor visitation.
The goal is not always to find a site with no competition.
The goal is to understand whether there is enough unmet or incremental demand for another store.
5. Complementary Places
Nearby businesses and destinations can have a major effect on store performance.
A coffee shop may benefit from offices, universities, transit hubs, and gyms. A furniture retailer may perform better near home improvement stores and other destination retailers.
Useful nearby places may include retail anchors, restaurants, cafés, offices, hotels, schools, entertainment venues, and transport hubs.
These locations can create shared customer journeys and increase the appeal of the area.
6. Accessibility and Visit Convenience
Two sites may serve similar populations but differ greatly in how easy they are to reach.
Retailers should consider road and public transport access, parking, entry and exit, pedestrian flow, visibility, and travel time from key customer areas.
A site with slightly lower foot traffic may still perform better if it is easier to enter, park, shop, and leave.
Accessibility should be judged from the customer’s point of view, not by distance alone.
7. Cannibalization Risk
Retailers with an existing store network need to know whether a new site will create new demand or simply shift visits from another location.
Visitor origins and trade areas can help reveal this.
High overlap with an existing store may suggest that the new site will redistribute demand rather than add growth.
Lower overlap may point to an opportunity to serve new neighborhoods, customer groups, or travel corridors.
Cannibalization analysis is especially important when both sites are in the same city or metro area.
Build a Side-by-Side Retail Site Scorecard
A weighted scorecard gives retail teams a consistent way to compare locations.
| Evaluation Factor | Suggested Weight |
|---|---|
| Target-customer fit | 20% |
| Relevant foot traffic | 20% |
| Trade-area reach | 15% |
| Competitive position | 15% |
| Accessibility and visibility | 10% |
| Complementary places | 10% |
| Cannibalization risk | 10% |
Score each site from one to five for every factor. Then multiply the score by its weight and calculate the total.
The weighting should reflect the retail format.
A convenience store may place more weight on frequent traffic and easy access. A luxury retailer may focus more on customer fit and surrounding brands. A destination retailer may place more weight on trade-area reach and customer travel behavior.
The scorecard should support the final decision, not replace commercial judgment.
Lease terms, occupancy costs, store format, operating needs, and financial forecasts still need to be reviewed separately.
Example of Two Sites With Similar Demographics
Consider two proposed retail sites with similar household income, age distribution, household composition, and spending potential.
Site A has moderate but steady weekday traffic. Its visitors come from a wider trade area, several complementary retailers are nearby, and there is limited overlap with the retailer’s existing stores.
Site B has higher total foot traffic. However, most visits happen on weekends, several direct competitors are nearby, and many visitors also use an existing store from the same retailer.
A demographic comparison may rank the sites equally.
A behavioral and spatial comparison may favor Site A because it offers steadier activity, stronger complementary demand, and more potential for net-new customers.
This does not mean Site A will always be the better choice.
It shows why demographics and total foot traffic should not be judged on their own.
How Factori Helps Compare Retail Sites
Factori helps retail teams compare candidate sites using privacy-first movement and place intelligence.
Retailers can evaluate foot traffic by day and time, visitor origins, trade areas, repeat visits, nearby POIs, competitor locations, visitor overlap, audience characteristics, existing-store overlap, and potential cannibalization.
Factori’s datasets can be explored through its platform or integrated into existing analytics and site-selection workflows through APIs and enterprise data delivery.
This helps teams move beyond static demographic screening and understand how each candidate site works in the real world.
Conclusion
When two retail sites have similar demographic profiles, the decision should be based on more than the people who live nearby.
Foot traffic quality, visitor origins, trade-area reach, competition, complementary places, accessibility, and cannibalization can reveal differences that demographic data cannot.
The strongest site is not always the one with the highest population or visitor count.
It is the one that offers the best mix of relevant customers, easy access, competitive opportunity, and incremental demand.
FAQs
How Do You Compare Two Retail Sites?
Compare the surrounding population, relevant foot traffic, visitor characteristics, trade areas, competitors, nearby POIs, accessibility, and overlap with existing stores.
A weighted scorecard can help evaluate both locations consistently.
Is Higher Foot Traffic Always Better for a Retail Site?
No. High foot traffic only creates value when visitors match the retailer’s target audience and their movement patterns fit the store’s offer and operating hours.
Why Are Trade Areas Important When Comparing Retail Sites?
Trade areas show where actual visitors come from.
They provide a more realistic view of customer reach than demographic analysis based only on fixed-distance boundaries.
Can Two Sites With Similar Population Profiles Perform Differently?
Yes. Differences in accessibility, visitor behavior, competition, nearby destinations, and customer movement can lead to very different store results.
What Data Is Needed for Retail Site Comparison?
Retailers typically need demographic, mobility, foot traffic, POI, competitor, audience, accessibility, and existing-store performance data.