Commercial real estate data can describe a property in remarkable detail. Teams can evaluate ownership, building characteristics, tenants, leases, rents, transactions, vacancy, financing, and comparable assets before making an investment decision.
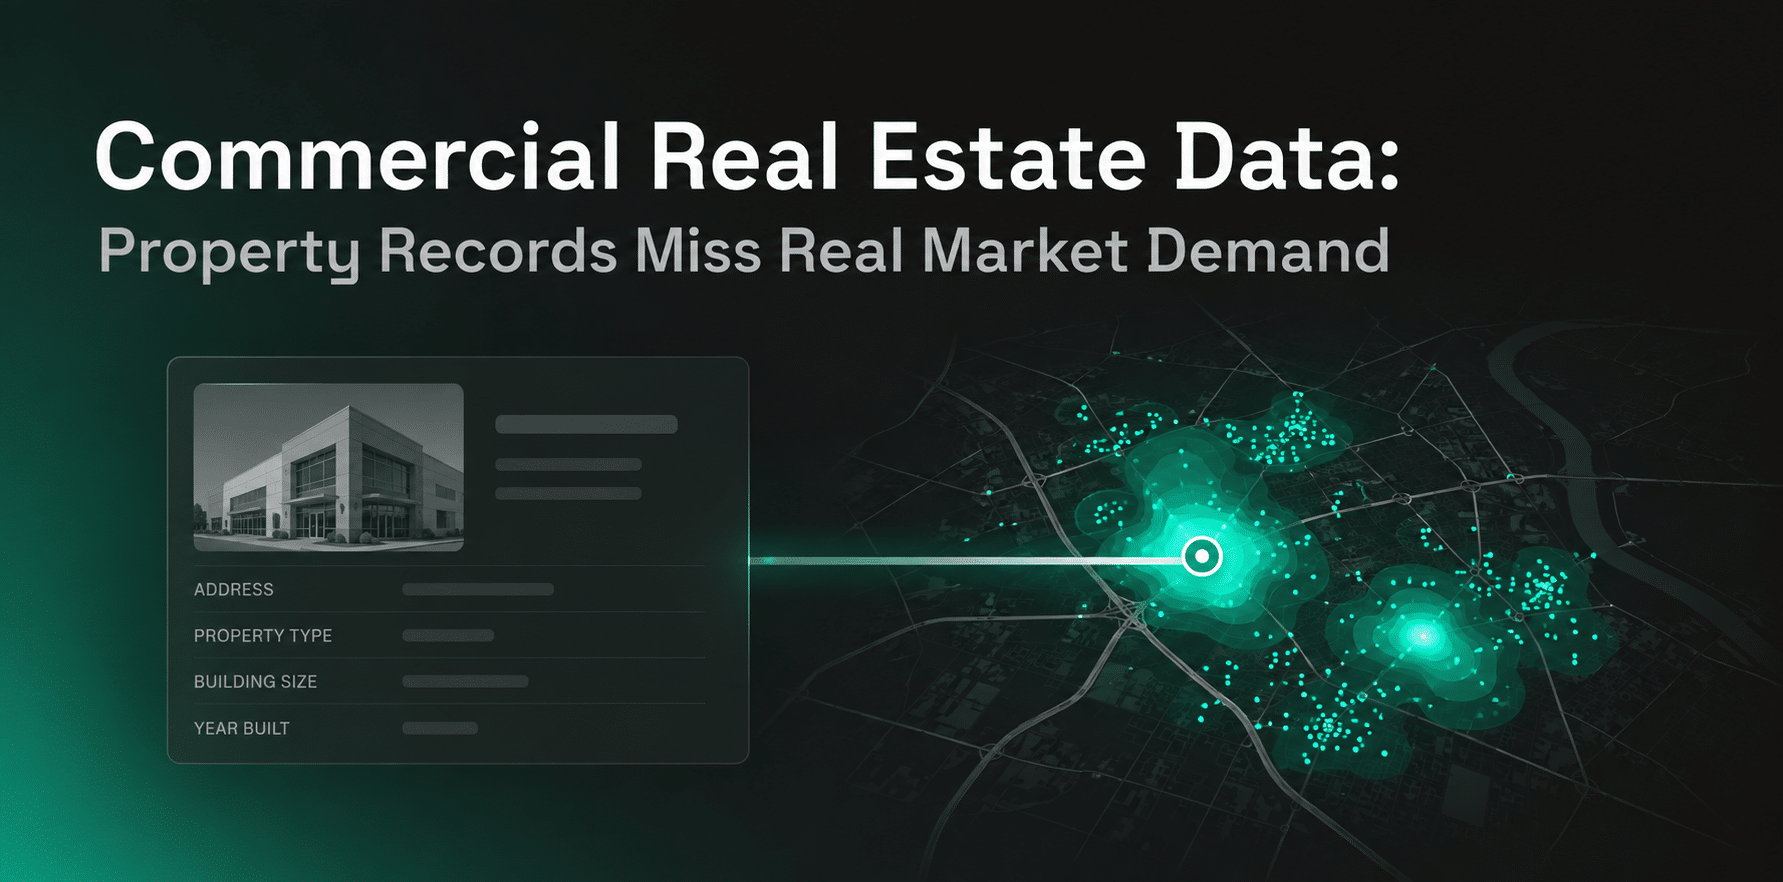
But a complete property record is not necessarily a complete view of demand. Two assets with similar property fundamentals can face very different outcomes because employment, population, accessibility, visitor activity, surrounding businesses, and movement patterns are changing differently around them.
Key Takeaway
- Commercial real estate data should combine asset, market, and demand signals rather than rely on property records alone.
- Property and transaction data explain the asset and market history, but they may miss early changes in local demand.
- Demand signals such as employment, accessibility, mobility, visitation, and surrounding business activity can add useful context to underwriting.
- Different property types require different demand indicators, so one universal demand model is rarely sufficient.
- External signals should be classified as observed, estimated, modeled, or indexed before they influence investment decisions.
- CRE teams should test whether new data improves a property-only and market-data baseline before adding it to underwriting.
- The strongest CRE data workflows connect external signals to internal asset, lease, tenant, and financial records through repeatable data pipelines.
Property Records Can Describe the Asset Without Explaining Demand
Commercial real estate data includes information about properties, transactions, leases, tenants, ownership, market performance, and the economic conditions surrounding an asset.
Traditional property and market data answers important questions:
- What is the building?
- Who owns it?
- What did comparable properties sell for?
- What rents are being achieved?
- What is current vacancy?
- Who occupies the space?
The gap appears when teams move from describing the asset to estimating what will support future demand.
Consider two retail properties with similar square footage, occupancy, asking rents, and comparable transactions. One may sit inside a growing activity corridor with increasing visitation and strong customer inflows. The other may depend on a shrinking catchment or weakening surrounding commercial activity.
The property records may look similar. The demand environment does not.
This distinction also matters during real estate site selection, where an attractive property still needs enough accessible demand around it to support the investment.
Separate Property Data From Demand Data

No single CRE dataset explains the whole investment.
| Data layer | Examples | What it helps answer | What it may miss |
| Asset data | Building size, parcel, ownership, zoning, physical attributes | What exactly are we evaluating? | Whether local demand is strengthening |
| Transaction data | Sale price, cap rate, financing, comparables | How has the market priced similar assets? | Demand shifts that have not reached transactions |
| Leasing data | Rent, vacancy, tenants, absorption | How is property-market performance changing? | Early changes in underlying demand |
| Economic data | Jobs, migration, population, industry growth | What structural forces may support demand? | Property-level and neighborhood-level behavior |
| Real-world activity data | Visits, movement, trade areas, surrounding places | How are people and places interacting now? | Property economics on its own |
The layers complement one another.
Property data explains the asset. Market data describes how similar assets are performing. Demand data adds evidence about the conditions that may influence what happens next.
That distinction is important because adding more datasets is not automatically better. Each layer should answer a question the existing analysis cannot answer well.
Demand Can Move Before Property Metrics Do
Vacancy, leasing activity, absorption, rent growth, and transaction volume remain essential CRE indicators. But they often confirm a change after it has started.
The National Association of REALTORS® makes this distinction in its Commercial Real Estate Demand Index. The index measures underlying economic drivers rather than vacancy, rent, or absorption and tracks more than 300 U.S. metropolitan areas.
The drivers also differ by property type:
| Property type | Demand signals that may matter |
| Office | Professional employment, commuting patterns, workforce accessibility |
| Industrial | Manufacturing, transportation, warehousing, road and logistics access |
| Retail | Consumer activity, visits, employment, trade areas, surrounding businesses |
| Multifamily | Population growth, migration, employment, accessibility, amenities |
NAR’s current methodology similarly uses different economic drivers for office, industrial, retail, and multifamily demand rather than applying one universal measure.
Real-world signals can add another layer. For retail assets, for example, foot traffic analytics can show whether physical activity around a property is growing, declining, seasonal, or shifting toward competing destinations.
These signals should not be treated as proof of future property performance. They are evidence to test against leasing, occupancy, income, and asset outcomes.
Build a Four-Layer CRE Decision Stack
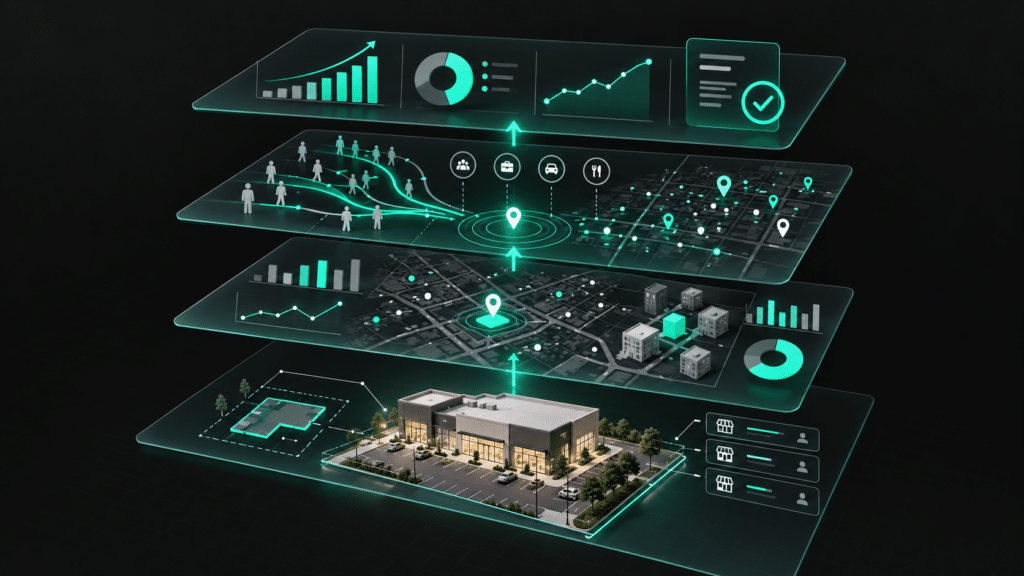
A stronger CRE analysis separates four questions.
- Asset: What are we underwriting?
Start with property characteristics, ownership, parcels, leases, tenants, zoning, physical condition, and other asset-level information.
- Market: How is the property market behaving?
Evaluate rents, vacancy, absorption, supply, transactions, financing, and comparable properties.
- Demand: What could strengthen or weaken future performance?
Add employment, population, accessibility, movement, visitor activity, nearby businesses, and other relevant demand indicators.
POI data can help structure the commercial environment surrounding an asset, while trade area analysis can show where visitors or customers actually originate rather than assuming demand follows administrative boundaries.
- Validation: Did those signals predict the outcome?
Compare the original investment hypothesis against occupancy, rent, NOI, leasing velocity, tenant performance, or asset value after the decision.
This final layer is critical. A demand signal only deserves continued weight if it repeatedly helps explain or predict the outcomes that matter.
Validate Demand Signals Before They Enter Underwriting
External data can improve an underwriting model, but only when teams understand what the metric represents.
An input may be:
Observed: A recorded property coordinate, visit, or event.
Estimated: A population, traffic, or visitation estimate derived from samples.
Modeled: A demand forecast or score produced by an analytical model.
Indexed: A relative measure where performance is compared with a benchmark.
These should not be treated as equivalent.
Teams should also test three additional questions.
Is the geography appropriate? Metro employment may help compare markets but may be too broad to explain one shopping center.
Was the signal available at decision time? Backtesting with information that became available later can overstate predictive value.
Does it add incremental information? Compare:
Property-only baseline
with
Property + market data
and then
Property + market + demand signals
The additional layer should improve something meaningful, such as forecast accuracy, investment ranking, risk classification, or the resulting decision.
Move From CRE Data to Decision-Grade Analysis
The same data stack can support different decisions.
For acquisitions, property data explains what is being bought, market data establishes pricing and leasing context, and demand signals help test whether the surrounding environment supports the underwriting assumptions.
For asset management, rent rolls and occupancy show current performance. Changes in visitor activity, nearby businesses, or local movement can provide additional evidence when investigating why an asset is strengthening or weakening.
For development and portfolio strategy, teams can combine supply and transaction data with population, employment, accessibility, commercial activity, and movement to identify markets where demand conditions may be changing.
The objective is not to replace established CRE metrics. It is to reduce the blind spot between what property databases record and what is happening around the asset.
Make CRE Data Usable Inside the Enterprise Data Stack
For analysts and data engineering teams, data quality is only part of the problem. CRE datasets also need to connect reliably.
That requires attention to:
- stable property and location identifiers
- address normalization and geocoding
- parcel, building, and POI matching
- spatial joins
- historical availability
- refresh cadence
- schema consistency
- APIs and bulk delivery
- warehouse compatibility
- licensing and permitted use
- data lineage
A dataset is not enterprise-ready simply because it exists in a dashboard.
If teams cannot consistently join external signals to internal asset, lease, tenant, transaction, or financial records, analysis becomes difficult to reproduce and scale.
This is where broader location intelligence workflows can connect business records with the real-world conditions surrounding each property.
How Factori Supports Commercial Real Estate Analysis
Factori provides real-world datasets covering places, mobility, visits, people, audiences, and other market context.
CRE teams can combine these signals with existing property, leasing, transaction, and financial datasets to analyze surrounding commercial activity, visitor patterns, trade areas, accessibility, and changes in local demand.
Factori does not need to replace traditional property databases for this workflow. Its role is to add another layer of real-world evidence around the asset.
Conclusion
Property records remain essential to commercial real estate analysis. But they primarily explain the asset and the property market around it.
They may not fully capture how demand is changing in the real world.
A stronger CRE data strategy combines asset information, market fundamentals, relevant demand signals, and post-decision validation. The goal is not to collect more data. It is to identify information that changes an underwriting assumption, improves a forecast, surfaces a risk earlier, or leads to a better investment decision.
FAQs
What data should commercial real estate teams use beyond property records?
Depending on the asset class and decision, teams can add employment, migration, demographics, accessibility, POI, mobility, visitation, trade-area, and other real-world demand signals to traditional property, transaction, and leasing data.
How can CRE teams measure demand before it appears in vacancy or rent data?
Teams can track relevant underlying drivers such as employment, population movement, business activity, visitation, accessibility, and local commercial changes. These should be treated as potential leading signals and validated against later property performance.
How should real-world demand data be validated before using it in underwriting?
First establish what the metric represents and whether it is observed, estimated, modeled, or indexed. Then test geographic relevance, data timing, historical stability, and whether adding the signal improves the existing property and market-data baseline.