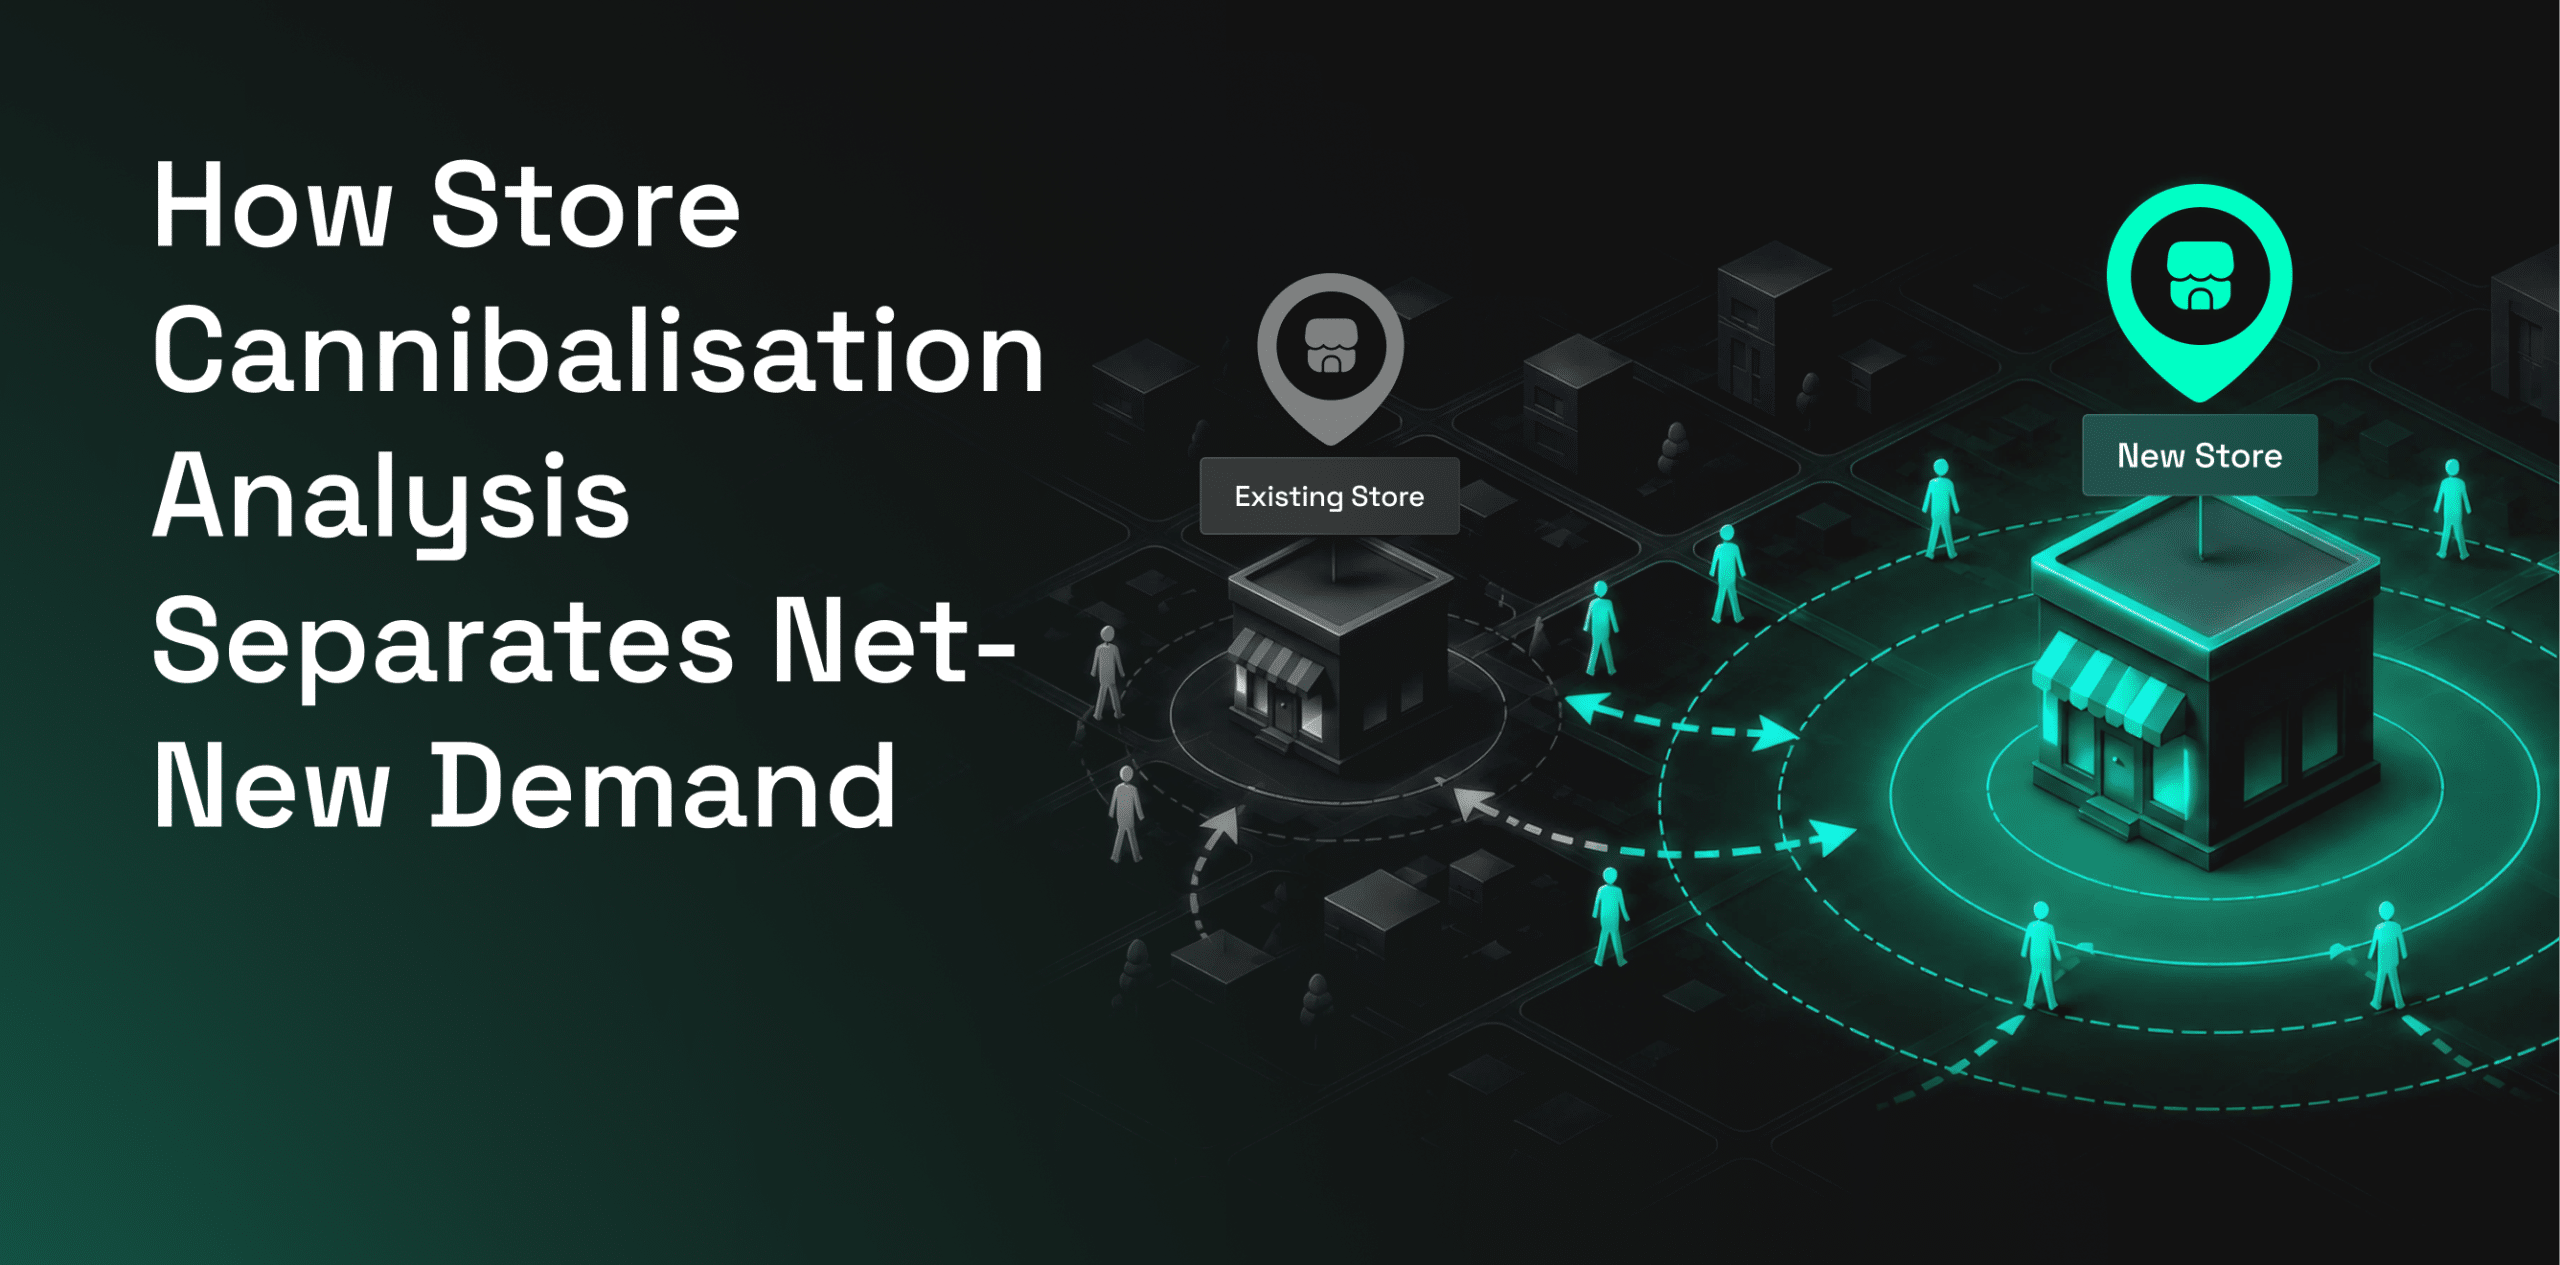
A new store can generate strong traffic without creating the same level of growth for the wider retail network.
Some customers may be new to the brand. Others may simply switch from an existing location.
Store cannibalisation analysis helps retailers separate these two outcomes.
Instead of asking only, “How much demand will this new store generate?”, retailers also need to ask, “Where will that demand come from?”
This network-level view helps expansion teams understand whether a proposed store creates new demand or redistributes demand that already exists.
Key Takeaway
- Strong candidate-store traffic does not automatically mean strong network growth.
- Retail cannibalization analysis separates transferred internal demand from genuinely incremental demand.
- Existing store performance must be measured before evaluating the impact of a new location.
- Observed customer catchments are generally more useful than simple radius-based trade areas for understanding overlap.
- Cannibalisation can affect stores beyond the nearest location if they share the same customer origins.
- The cannibalisation rate measures transferred demand as a share of total projected candidate-store demand.
- Net-new demand is calculated after subtracting transferred internal demand.
- Retailers should evaluate the total portfolio impact, not the new store in isolation.
- Low, expected, and high-transfer scenarios help teams understand expansion risk.
- Some cannibalisation can still be acceptable if the new location improves coverage, captures competitor demand, or strengthens the overall network.
- Post-opening measurement can improve future store cannibalisation analysis and expansion forecasts.
What Is Net-New Demand?
Net-new demand is demand the retailer would not have captured without opening the new location.
It can come from:
- Previously underserved customers
- Shoppers currently visiting competitors
- Customers who find existing stores too far away
- New trips created by better accessibility or coverage
Cannibalised demand is different.
It happens when customers move visits or spending from an existing store to the new location.
The candidate store gains demand, but the retail network does not gain the same amount.
A proposed store’s demand can therefore come from four sources:
Candidate store demand = transferred internal demand + competitor capture + previously unserved demand + newly generated demand
Only the transferred internal demand represents store cannibalisation.
Why Gross Store Forecasts Can Be Misleading
A standalone forecast may show that a proposed store can generate strong visits or revenue.
But it does not always show where those customers would have shopped without the new store.
Suppose a candidate location is forecast to generate 100,000 annual visits.
If 35,000 visits would otherwise have gone to existing stores, only 65,000 visits are net-new before other market effects are considered.
This is where retail cannibalization analysis becomes important.
A forecast based only on the following can overstate expansion potential:
- Local population
- Fixed-radius trade areas
- Road traffic
- Demographics
- Projected store revenue
- Distance from the nearest store
These indicators can show that demand exists.
They cannot show whether the retailer already captures that demand somewhere else in the network.
What Data Is Needed for Store Cannibalisation Analysis?
Store cannibalisation analysis requires a view of the entire network, not just the proposed location.
| Data Input | What It Helps Measure |
|---|---|
| Existing store visits | Current demand across the retail network |
| Visitor-origin patterns | Where customers to each store travel from |
| Travel time and distance | How easily shoppers can substitute one store for another |
| Catchment overlap | Areas where stores compete for the same demand |
| Competitive visits | Demand that may be captured from competing brands |
| POI data | Nearby competitors, demand generators, and complementary locations |
| Demographic and consumer attributes | Whether the site reaches a different customer group |
| Historical store openings | How similar launches affected nearby stores |
Aggregated mobility data is particularly useful because it can show how people actually travel between locations.
This can produce more realistic catchment areas than simple distance circles.
Esri also uses trade-area overlap as a way to measure retail cannibalization across store networks. See Esri’s cannibalization analysis.
How to Conduct Retail Cannibalization Analysis
A structured process helps retailers estimate how much demand is genuinely incremental.
1. Establish the Existing Store Baseline
Start with the normal performance of stores that could be affected.
Measure:
- Visits
- Transactions
- Revenue
- Average order value
- Visitor origins
- Visit frequency
- Daypart and weekday patterns
The baseline should cover enough time to account for seasonality, promotions, holidays, and short-term changes.
Without a stable baseline, normal fluctuations may be mistaken for cannibalisation.
2. Build Observed Store Catchments
An observed catchment shows where a store’s actual visitors come from.
This is different from drawing a fixed circle around a store.
Observed catchments can reflect:
- Road networks
- Public transport
- Real travel behavior
- Competitor locations
- Physical boundaries
- Urban and suburban differences
- Customer willingness to travel
They provide a stronger view of a store’s true customer reach.
3. Estimate the Candidate Store Catchment
Next, estimate where the proposed store is likely to draw customers from.
Inputs may include:
- Comparable existing stores
- Local mobility patterns
- Travel time
- Nearby POIs
- Population characteristics
- Competitive conditions
The key question is not just how large the catchment is.
It is how much of that catchment is already being served by existing stores.
A site reaching a new market is more likely to create incremental demand.
A site reaching the same customers as existing locations has a greater risk of cannibalisation.
4. Measure Catchment and Visitor Overlap
Do not compare the candidate store only with the closest existing store.
A farther location may still compete for the same customers.
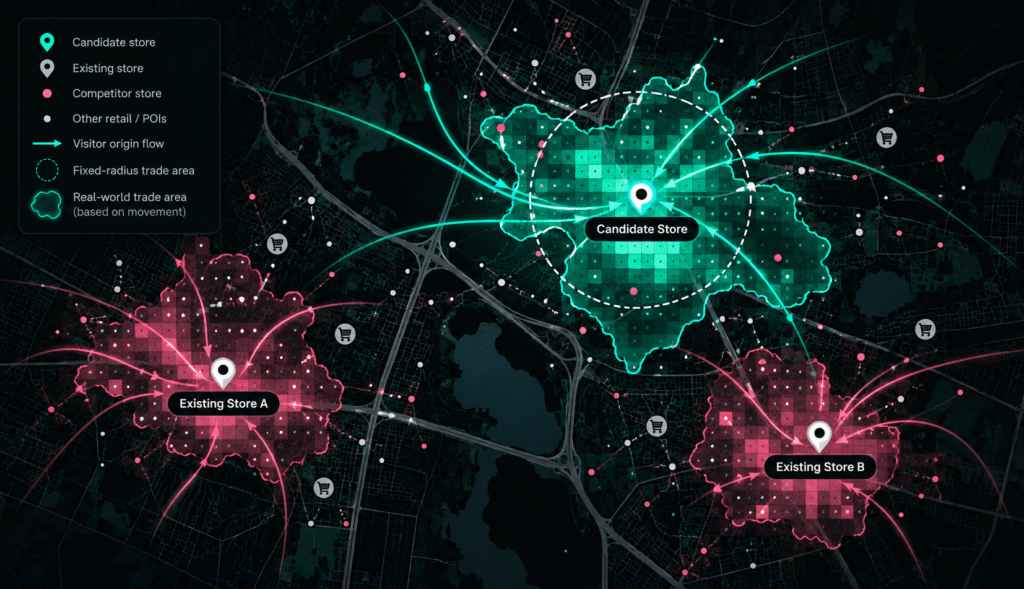
Store cannibalisation analysis should consider:
- Shared visitor-origin areas
- Common travel routes
- Similar store formats
- Product overlap
- Visit occasions
- Travel-time differences
- Existing store capacity
Geographic overlap alone does not prove cannibalisation.
Customers may still prefer one location because of convenience, assortment, service, or store quality.
Esri’s retail site-selection guidance similarly highlights trade-area competition and business cannibalization as factors when evaluating new locations. Read the Esri site-selection example.
5. Estimate Transferred Demand
Transferred demand is the share of candidate-store demand expected to move from existing stores.
A simple calculation is:
Cannibalisation rate = transferred demand ÷ total projected candidate demand
For example:
- Projected candidate visits: 120,000
- Visits transferred from existing stores: 30,000
- Cannibalisation rate: 25%
The analysis should also show which stores are expected to lose demand.
The financial impact can differ significantly between stores.
Losing a small amount of demand at a highly profitable location may matter more than losing more demand at a weaker store.
6. Calculate Net-New Demand
Once transferred demand is estimated:
Net-new demand = projected candidate demand − transferred demand
Retailers should also look at portfolio impact:
Net portfolio impact = candidate-store demand − demand lost across existing stores
This is a more useful measure of expansion value than candidate-store performance alone.
7. Test Multiple Cannibalisation Scenarios
Store cannibalisation analysis should not depend on one forecast.
Test at least three scenarios.
Low Transfer
The new store reaches a largely underserved catchment.
Expected Transfer
Demand shifts based on observed overlap and similar store openings.
High Transfer
Existing stores lose more demand than expected.
Each scenario should consider:
- Visits
- Revenue
- Margin
- Existing-store performance
- Operating costs
- Payback period
This gives decision-makers a range of possible outcomes rather than one fixed estimate.
When Is Store Cannibalisation Acceptable?
Cannibalisation is not automatically a reason to reject a new location.
A store may still improve the overall network by:
- Capturing competitor demand
- Improving market coverage
- Reducing customer travel time
- Relieving an overcrowded location
- Supporting delivery or fulfilment
- Protecting market share
- Replacing an outdated store
The objective is not necessarily zero cannibalisation.
The better question is whether the new store creates enough incremental value to justify the transferred demand, investment, and operating costs.
Common Store Cannibalisation Analysis Mistakes
Retailers can overestimate a site’s value when they:
- Treat every candidate-store visit as net-new
- Analyze only the nearest existing store
- Use fixed-radius catchments
- Ignore differences between store formats
- Ignore competitor capture
- Measure revenue without margin
- Evaluate the candidate separately from the network
- Use demographics instead of visitor behavior
- Fail to validate forecasts after opening
Post-opening measurement is especially important.
Retailers should compare predicted cannibalisation with actual changes in visits, sales, and visitor origins.
Those results can improve future expansion models.
How Factori Supports Store Cannibalisation Analysis
Factori provides privacy-aware Mobility, Visit Intelligence, and POI data that can support retail cannibalization analysis and network planning.
Retail teams can use Factori data to:
- Build catchments from aggregated movement patterns
- Compare visitor origins between stores
- Measure overlap around candidate locations
- Identify competitors and demand generators
- Understand travel patterns
- Compare proposed sites with similar stores
- Monitor changes after opening
Factori datasets can be accessed through APIs, bulk data, cloud environments, and the Factori platform.
This helps retailers bring real-world data into site selection, forecasting, and network-planning workflows.
Conclusion
A strong candidate-store forecast does not automatically mean strong network growth.
Retailers need to understand how much demand is genuinely new and how much will shift from existing locations.
Retail cannibalization analysis combines catchments, mobility patterns, visitor origins, competitive context, and network forecasting to measure that difference.
The goal is not to eliminate cannibalisation completely.
It is to understand whether the new location creates enough incremental value for the wider retail network.
FAQs
What Is Store Cannibalisation Analysis?
Store cannibalisation analysis measures how much demand a proposed or newly opened store may transfer from existing locations within the same retail network.
What Is Retail Cannibalization Analysis?
Retail cannibalization analysis evaluates whether a new retail location will create incremental demand or shift visits and sales from existing stores.
What Is the Difference Between Net-New and Cannibalised Demand?
Net-new demand is demand the retailer would not have captured without the new store.
Cannibalised demand is demand transferred from another location within the same network.
How Is Store Cannibalisation Calculated?
A basic cannibalisation rate divides transferred demand by the total projected demand of the candidate store.
What Is an Acceptable Cannibalisation Rate?
There is no universal rate.
The answer depends on incremental margin, competitor capture, market coverage, operating costs, payback period, and the strategic role of the new location.