Talk to the real world with Factori MCP - Get Started Now
Talk to the real world with Factori MCP - Get Started Now
Check any US address for real foot traffic, visitor profile and nearby competition. Rank your shortlist side by side and see how much a new store would cannibalize your existing locations.
Stop stitching foot traffic, demographics and spreadsheets together. Check a site, rank your finalists and test a new store against your own, all in one place.
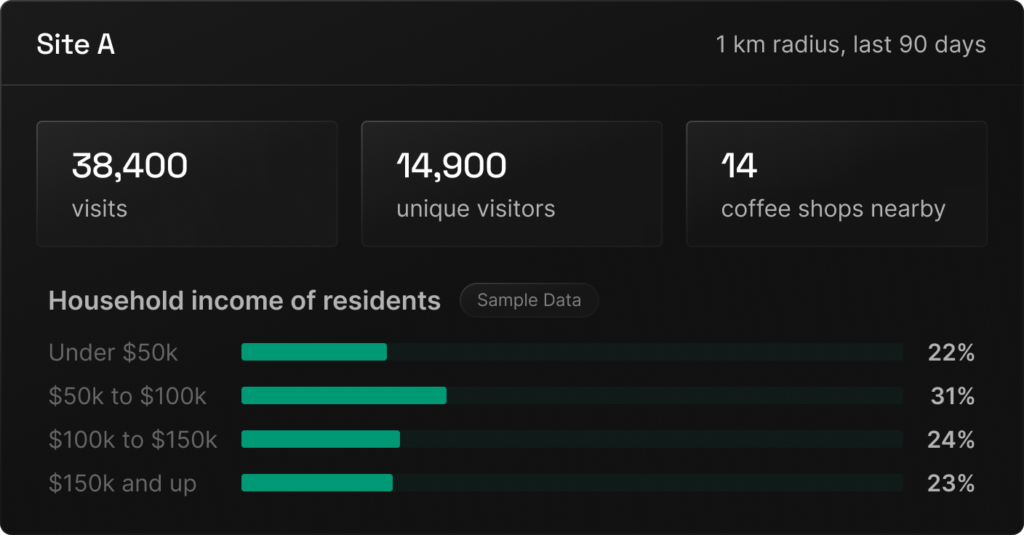
Pin an address or draw an area. See how many people visit, who lives nearby, and how crowded the market already is.
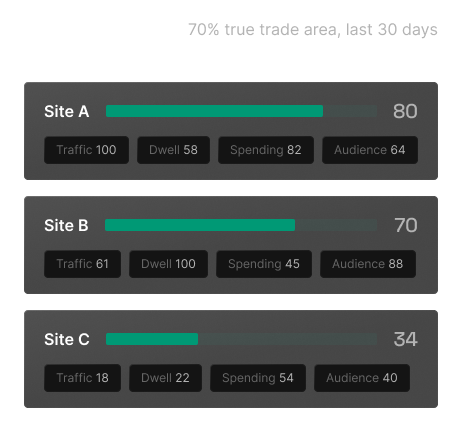
Put two or three finalists side by side. Each gets a score out of 100 on traffic, dwell time, spending power, audience and market size.
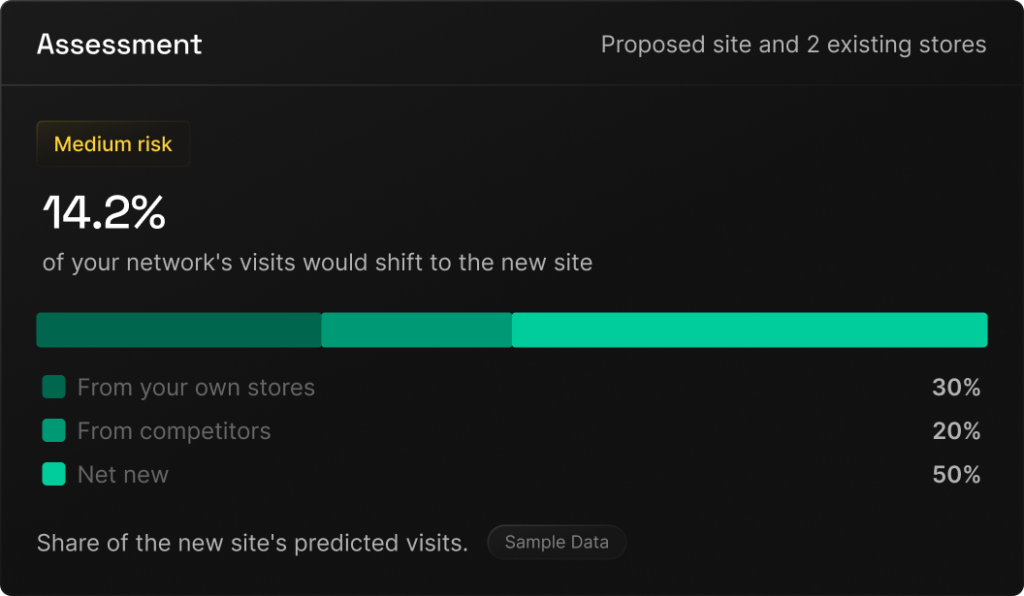
Add the stores you already run. See how many of the new site’s visits would come from them, from competitors and how many are brand new. It shows demand overlap, not a sales forecast.

Search an address, zip code or coordinates or draw an area on the map.

Use a radius, a drive, bike or walk time or a true trade area built from where real visitors live.

Every result is saved to a project. Promote a winner to a deal and share it with your team.
Traffic, residents, the local business mix and cannibalization all sit in one place and run on the same map area. Results are saved to projects, so a teammate opens the same stored analysis you did instead of rebuilding it.
Observed foot traffic, resident demographics and a database of local businesses, all aggregated on a hexagonal grid across the US. Every visit-based report shows a “Data as of” date so you know how current it is.
Both. Radius, travel-time and drawn-area reports describe residents. A true trade area is built from where a site’s visitors live, so you see who really turns up. Run both on one site and compare.
Cannibalization needs observed visits at every site, so a brand-new location can’t be scored directly. Pin a nearby existing place that stands in for it, such as the shopping center it sits in.
Everyone in your Factori workspace can see every project, analysis and deal. Each change records who made it and when.
Nothing during the launch period. Running analyses is free for every workspace with access, with no usage meter to watch, and there’s no demo or sales call to get through first.
Join the early access waitlist and be among the first to use the site selection module.
Products
Solutions By Use Case
By Use Case
By Industry
© 2026 Factori. All rights reserved.







