What Is Foot Traffic Analysis?
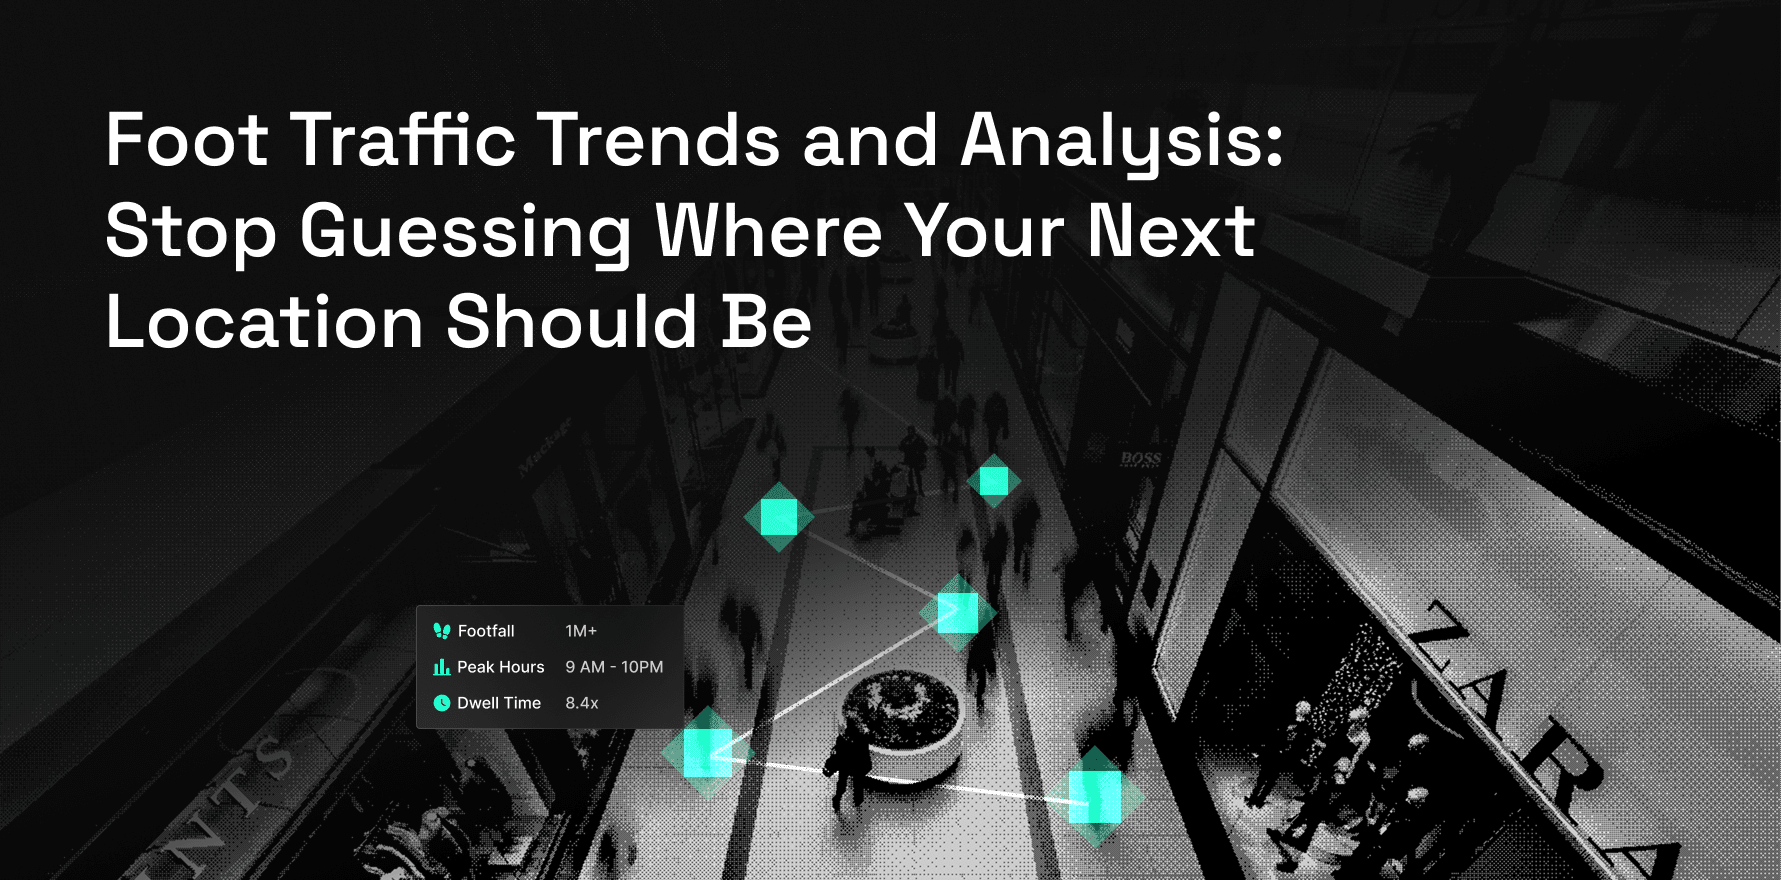
Foot traffic analysis examines how many people visit a physical location, when they visit, how long they stay, and how those visits connect to sales, staffing, and operations.
It’s used across retail, restaurants, commercial real estate, healthcare, and entertainment to answer one practical question: is this location, campaign, layout, or schedule working?
Key Metrics to Track
A useful analysis rests on a handful of core metrics:
- Visitor count: Total people entering a location
- Unique visitors: Individual visitors, excluding repeat visits
- Visit frequency: How often customers return
- Dwell time: Average time spent on-site
- Peak hours: Busiest times of day or week
- Conversion rate: Share of visitors who purchase
- Traffic source: Walk-ins, events, nearby businesses, or campaigns
2026 Trends: What the Data Shows
Physical locations are proving resilient. Colliers’ retail traffic data shows a consistent, if moderating, upswing:
- January 2026: Foot traffic up 3.7% YoY, retail sales up 3.1%, despite winter weather disruptions (Colliers)
- February 2026: Foot traffic up 4.7% YoY, aided by early tax refunds, though shoppers stayed selective on discretionary spend (Colliers)
- March 2026: Foot traffic up 1.7%, retail sales up 4.5%, with apparel and electronics leading (Colliers)
- Full-year 2025: Foot traffic up 1.8%, reflecting steady in-store engagement from increasingly value-conscious shoppers
The pattern: traffic is growing, but unevenly by category and month. That’s exactly why trend-level averages aren’t enough for a location-level decision.
Common Visitation Patterns
Beneath the headline numbers, a few patterns repeat across industries.
Weekend and holiday traffic runs higher than weekdays. Restaurants see distinct lunch and evening peaks. Back-to-school and holiday seasons drive predictable surges. Weather, local events, and promotions can also swing daily visitation more than any long-term trend.
How Businesses Use Foot Traffic Trends and Analysis
Teams evaluating foot traffic data are usually trying to solve one of six problems:
Optimize Staffing Schedules
Knowing when traffic peaks helps teams align staffing levels with actual demand instead of relying on fixed schedules.
Measure Marketing Campaign Performance
Changes in visitation before, during, and after campaigns can help teams understand whether media activity is translating into physical visits.
Improve Store Layout
Movement and dwell patterns can help identify which areas of a location attract attention and where engagement drops.
Select New Store Locations
Foot traffic trends help teams compare potential sites based on observed activity rather than demographics or assumptions alone.
Forecast Inventory Demand
Visit patterns can provide an additional demand signal for inventory planning, especially around seasonal peaks and promotions.
Benchmark Against Competitors
Third-party foot traffic data allows teams to compare visitation patterns across their own and competitor locations.
Each of these needs traffic data broken down by location and time window, not just a national trend line.
Why Foot Traffic Data Accuracy Matters
Foot traffic gets measured through door counters, computer vision cameras, Wi-Fi or Bluetooth sensing, mobile location analytics, POS integration, and IoT sensors.
Most platforms blend several of these rather than relying on one, and it matters which blend. A single sensor type tends to undercount edge cases such as multiple entrances, outdoor seating, or mixed-use buildings, while mobile-location datasets estimate traffic from a sample of devices rather than a full census.
That sampling gap is where accuracy separates good analysis from unreliable analysis.
Challenges in Foot Traffic Analysis
Before acting on any foot traffic dataset, it’s worth asking a provider how they handle:
- Privacy regulations governing location data
- Seasonal and weather-driven swings
- Distinguishing employees from customers
- Accounting for repeat visitors
- Whether the data is sampled or modeled from a broad enough panel to represent your actual footprint
Analysis is most valuable when traffic numbers are paired with sales, conversion, and operational data, so you see not just who showed up, but what that visit was worth.
How Factori Helps
Factori combines mobility, places, and contextual signals to help retail, CRE, and marketing teams analyze foot traffic at the level of individual locations.
Teams can use the data for site selection, staffing, benchmarking, and campaign measurement through API, MCP-based workflows, or direct cloud delivery.
Conclusion
The 2026 trends show that physical traffic is growing, but national averages do not tell you whether your next lease, Tuesday staffing plan, or latest campaign is working.
Foot traffic trends and analysis become valuable when they are applied at the level of actual locations, compared over time, and connected to business outcomes such as sales, staffing efficiency, and marketing performance.
FAQs
What’s the Difference Between Foot Traffic and Foot Traffic Analysis?
Foot traffic is the raw count of visitors to a location. Analysis adds context such as frequency, dwell time, conversion, and comparison over time that turns the count into a decision-ready insight.
How Accurate Is Mobile Location Data for Foot Traffic?
It varies by provider. Because mobile-location data is modeled from a sample of devices, accuracy depends on panel size and methodology. Providers with broader signal coverage produce estimates closer to actual visitation.
How Often Should Foot Traffic Data Be Reviewed?
Most retail and CRE teams review it monthly at minimum, with weekly checks around promotions, new openings, or seasonal peaks, since traffic patterns shift faster than typical reporting cycles.
Can Foot Traffic Data Be Used to Benchmark Against Competitors?
Yes. Aggregated, third-party foot traffic data lets you compare visitation, dwell time, and visit frequency at competitor locations, not just your own, which is difficult to do with in-store sensors alone.
What Should I Look for When Choosing a Foot Traffic Data Provider?
Prioritize panel size and signal coverage, how frequently the data refreshes, whether it can be paired with sales and demographic data, and how the provider handles privacy compliance.