Talk to the real world with Factori MCP - Get Started Now
Talk to the real world with Factori MCP - Get Started Now
Understand visit patterns around your stores, branches, hotels, and depots with privacy‑safe mobility data. Use it to see where people come from, when they show up, and how that changes over time.
Trusted by





Trusted by
How many people visit an area, how often, and on which days and times.

Where visits are rising, falling, or shifting across your network.

Which neighborhoods & corridors your visitors are really coming from.

Weekday vs weekend, lunch vs evening, event days vs “normal” days.

All Mobility data is aggregated and privacy-safe — never device level or identifiable.
Capture people who visit the area but don’t transact yet.
Match staffing, inventory, and hours to actual traffic patterns.
Spot areas with strong organic footfall and understand cannibalization risk.
When performance moves, quickly answer: “Did the traffic change, or just conversion?”
Leverage foot traffic analytics to anticipate real-world demand before it shows up in your sales data.
Consumer foot traffic data helps you align labor, inventory, and operations to actual visit patterns, not lagging indicators.

Compare potential locations using retail foot traffic data, not gut feel or single-source proxies.
Mobility signals show you which sites already draw strong organic footfall and where consumer movement trends are heading.
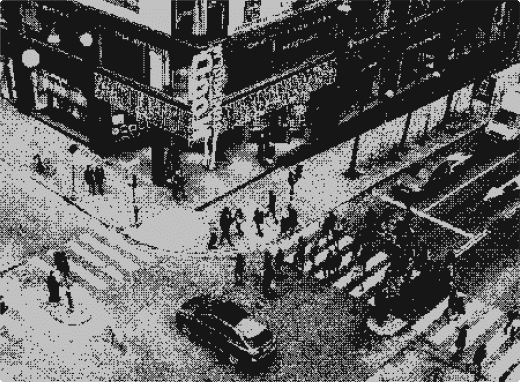
Use aggregated foot traffic data to understand who passes by, when they arrive and what that means for stock and assortment decisions. Aligning merchandising to actual mobility patterns reduces waste and improves in-store readiness.

Build a data-driven marketing plan by anchoring campaign spend to high-traffic zones and real movement trends.
Foot traffic analytics lets you measure lift before and after campaigns, turning consumer foot traffic data into a measurable feedback loop for data-driven marketing planning.

Build staffing plans that reflect real peak hours, seasonal mobility shifts and location-level foot traffic patterns.
Retail foot traffic data makes it easier to right-size teams across your network without relying solely on historical sales.

Use mobility signals to map catchments, understand corridor demand and plan depot locations around where consumer foot traffic is actually concentrated.
Aggregated foot traffic data helps logistics teams reduce route inefficiency and better match capacity to real-world movement

Aggregate mobility data takes anonymized location signals from millions of devices and groups them into collective movement patterns instead of individual trips. That’s what makes it useful for understanding real-world foot traffic, popular travel routes, and how long people spend in an area, all without exposing anyone’s identity.
Factori’s Aggregated Mobility resolves that movement data to the H3 hexagonal grid, built from 90B+ daily real-world signals across 229 countries.
country covered
refresh in major markets
hex grid resolution*
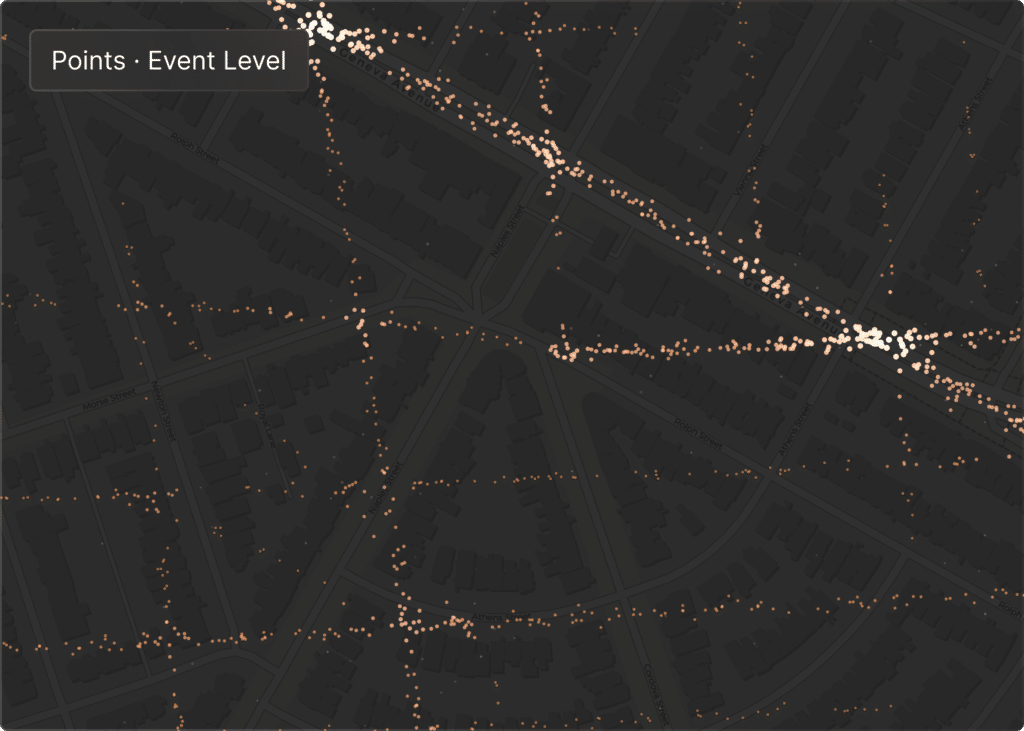
Every individual location signal, anonymized and plotted point by point. This is the raw movement data before it’s grouped into patterns.
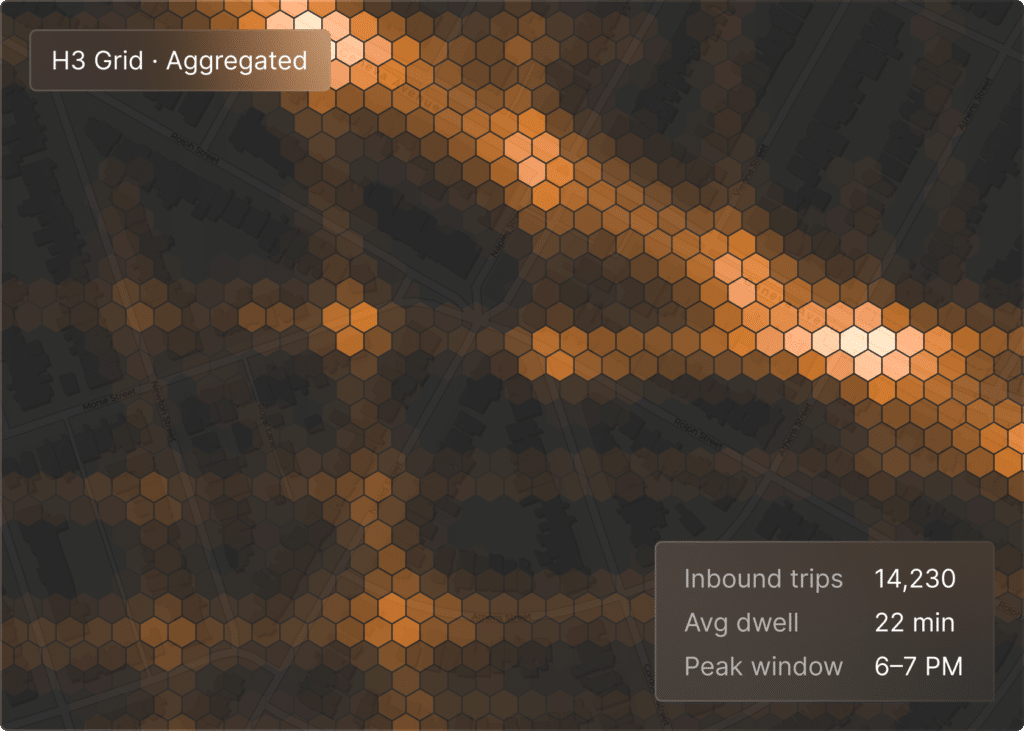
The same movement, grouped into Factori’s H3 hex grid. Inbound trips, dwell time, and peak hours, ready to query for any market.
Every pattern comes from real anonymized location signals, not survey panels or estimated foot traffic.
Compare foot traffic, dwell time and trade areas across USA without stitching together regional data vendors.
The H3 grid refreshes every 24–48 hours and is queryable through raw feed, REST API, or Factori MCP.
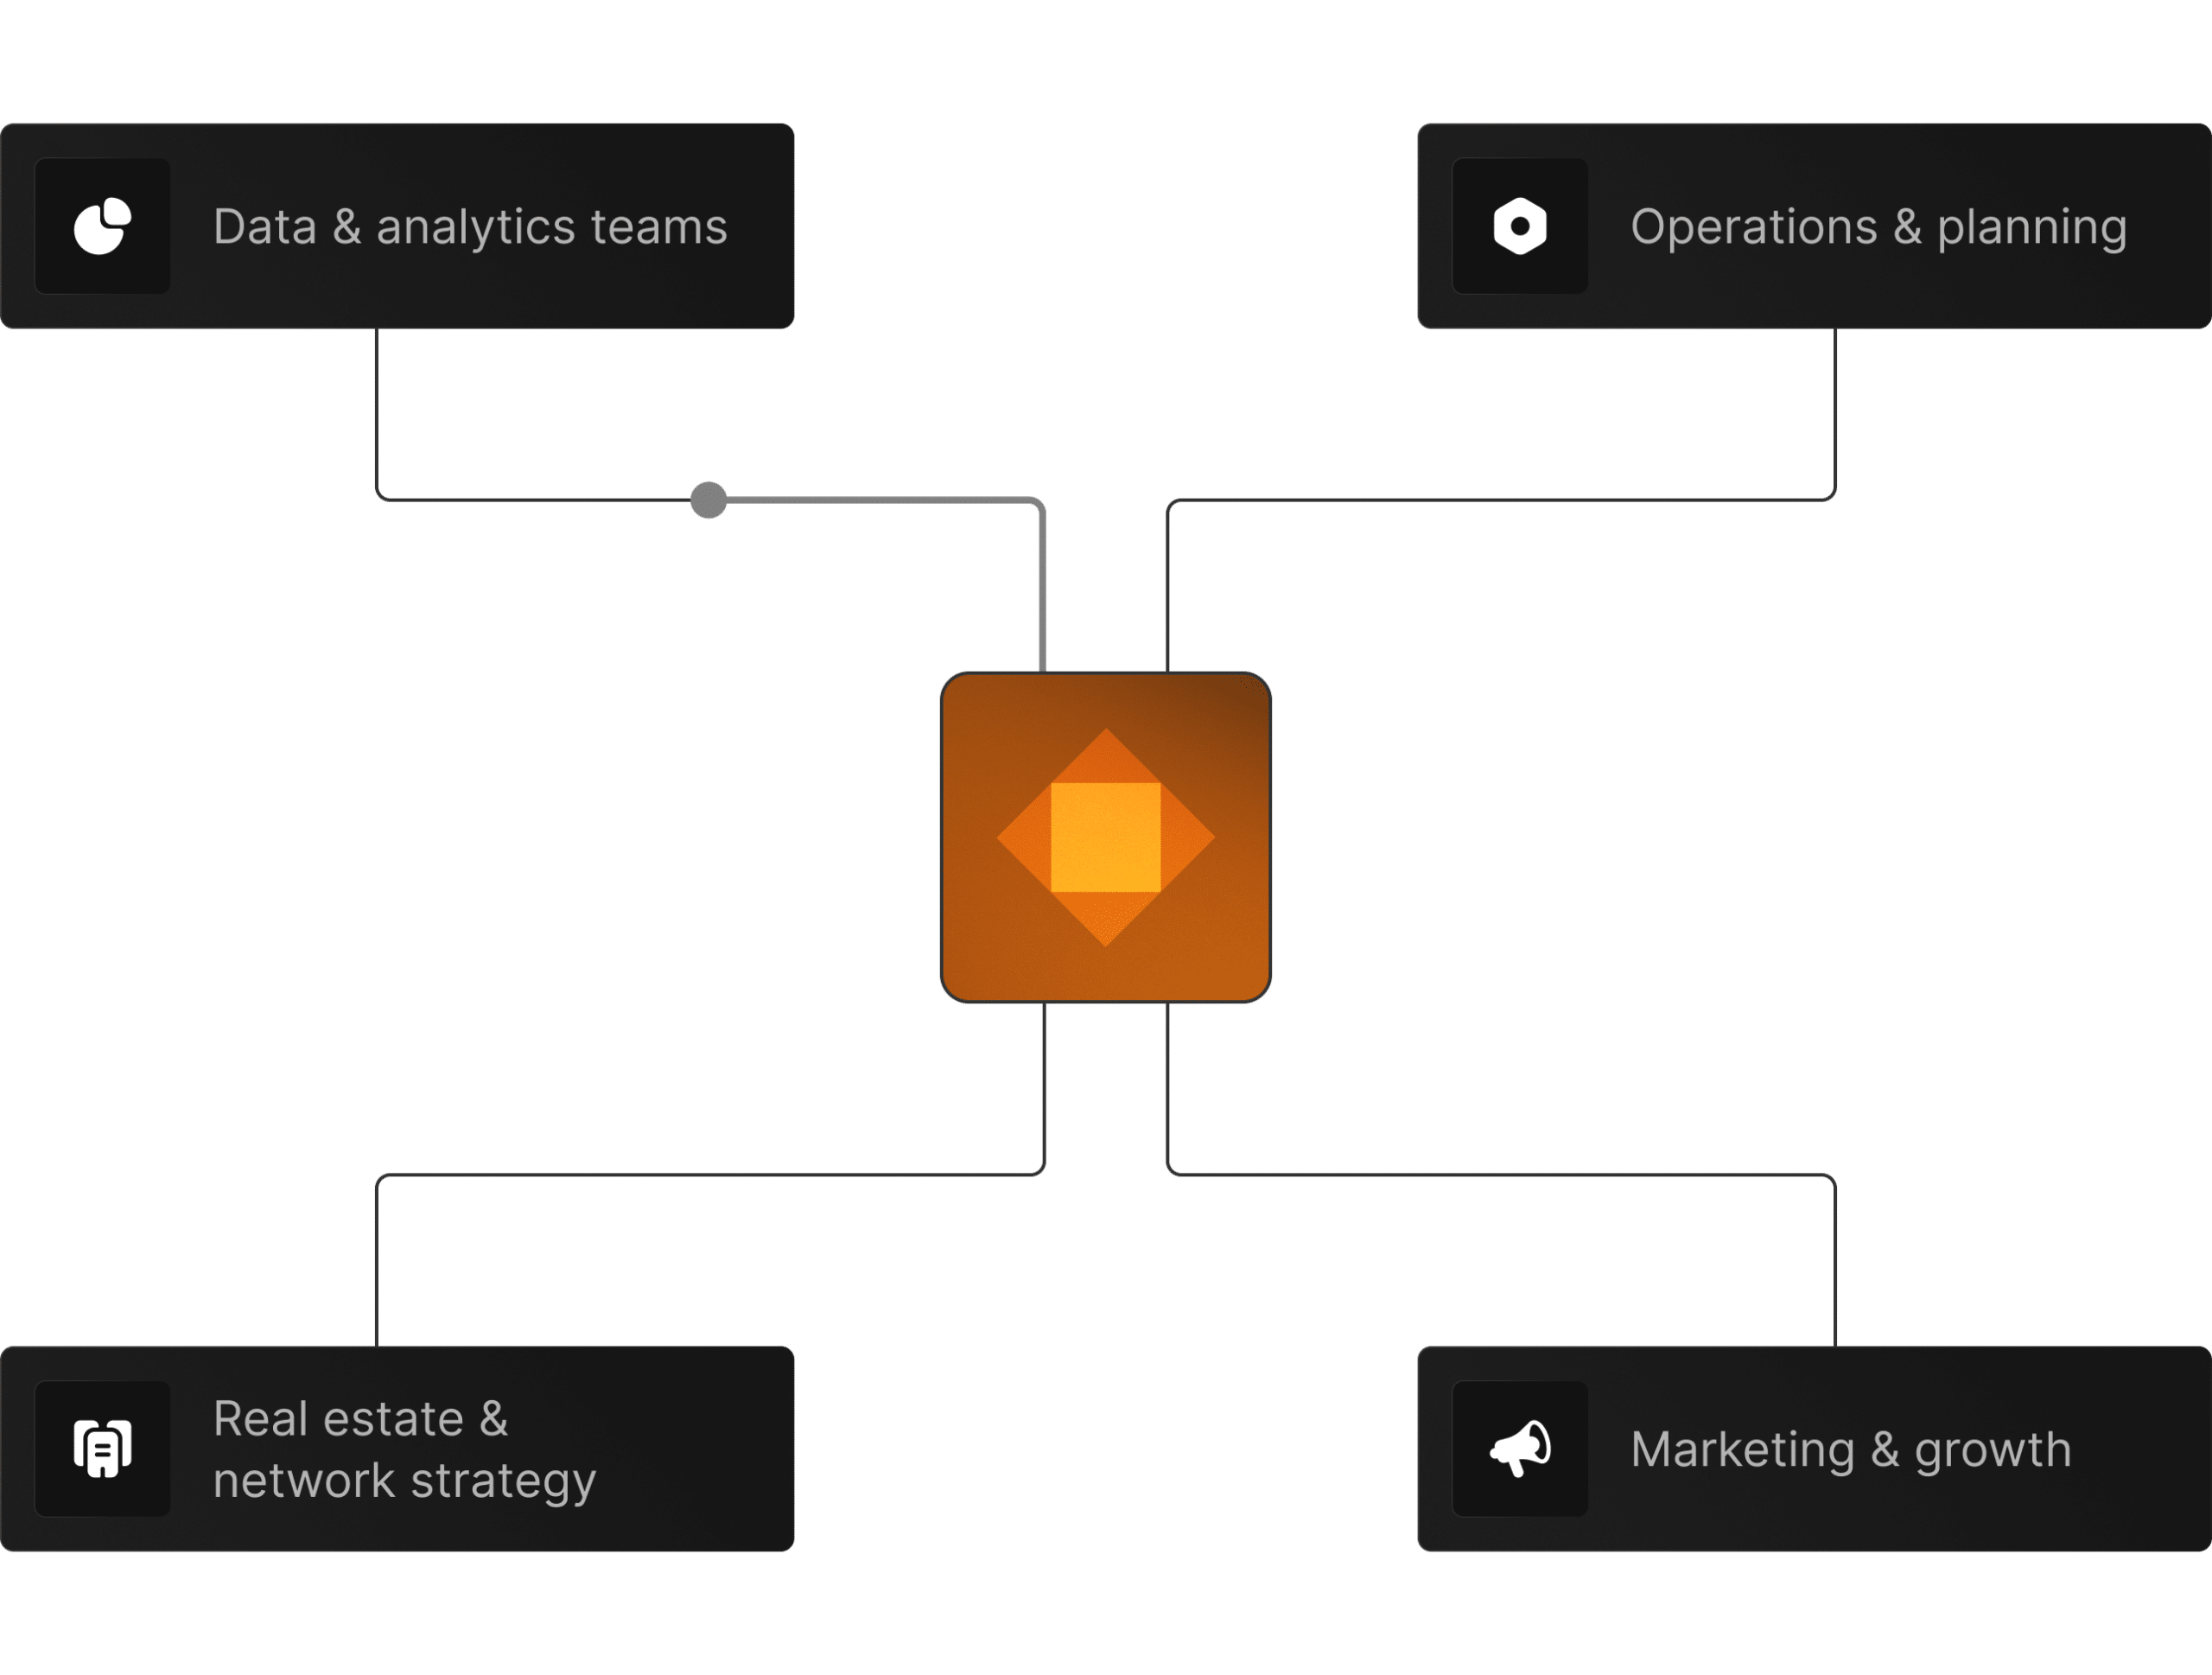
 Data & analytics teams
Looking for clean, reliable visit data to plug into models and dashboards.
 Operations & planning
Owners of staffing, service levels, and store/branch performance.
 Real estate & network strategy
Teams deciding where to open, close, or relocate sites.
 Marketing & growth
Teams that want to put spend where people actually are.





See how industry leaders are revolutionizing their strategies with Factori

“We needed to understand catchment-level movement patterns, not just whether people visited a store, but how traffic flows in and around our trade areas were shifting over time.
Factori’s Mobility data gave us aggregate signals at the right geographic granularity, with consistent methodology across markets. It’s now a standard input in how we evaluate store performance and plan staffing.”
We map Mobility data to your stores, branches, depots, or trade areas.

Explore a few key markets to see how traffic patterns show up for you.
Add locations, use cases, and teams as you see results.
Factori Mobility Data helps businesses understand aggregated, privacy-safe movement and foot traffic patterns around stores, branches, hotels, depots, trade areas, corridors, and markets. It turns real-world visit behavior into ready-to-use signals for forecasting, site selection, operations, and marketing planning.
Businesses use Factori Mobility Data for footfall analytics, demand forecasting, trade area analysis, retail site selection, labor planning, inventory planning, campaign measurement, and market expansion. It helps teams understand how real-world movement affects performance across locations and markets.
Mobility Data helps forecasting teams measure how people move around each location before transactions happen. It can improve store-level sales forecasts, footfall forecasts, staffing plans, inventory forecasts, and short-term demand models.
Factori builds Mobility Data from privacy-safe, aggregated movement signals and location intelligence sources. The data is processed into non-personal features such as footfall trends, visit frequency, visitor origins, dwell patterns, trade-area behavior, and daypart movement.
Customers can access using any of these options:
(1) Download a 100-row sample CSV for FREE
(2) Connect the MCP server to your AI client and query in natural language
(3) Book a 30-minute discovery call, validate fit against a specific use case.
(4) Factori Platform
Mobility Data can be updated on a recurring cadence depending on market, source availability, and use case. Common refresh options include daily, weekly, monthly, or custom schedules for forecasting and planning workflows.
Internal sales data shows what happened after customers converted. Mobility Data shows real-world demand before conversion, helping teams understand traffic shifts, trade-area strength, cannibalization risk, and local demand changes earlier.
Products
Solutions By Use Case
By Use Case
By Industry
© 2026 Factori. All rights reserved.







