A store can attract more visitors while generating fewer sales. Another can report stable foot traffic even as nearby competitors gain visitors. Door counters and POS systems reveal what happens inside the store, but they cannot fully explain changes in surrounding demand.
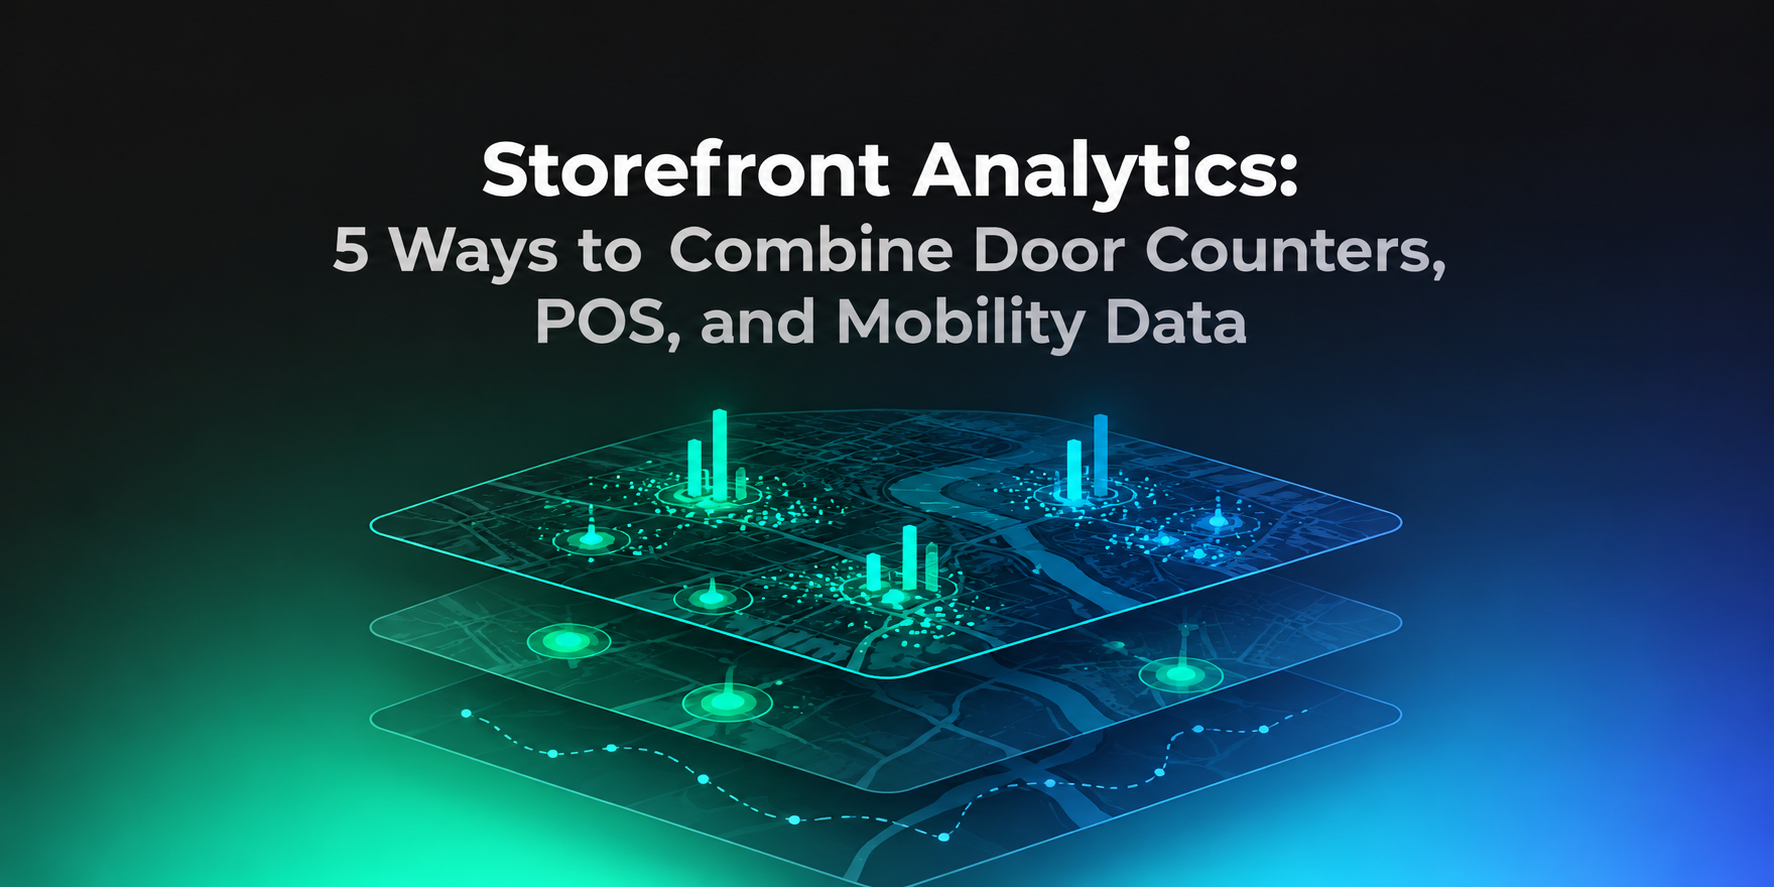
Storefront analytics combines door-counter data, point-of-sale (POS) transactions, and Mobility Data to measure store performance, identify conversion gaps, and evaluate market opportunities. Retailers can use these datasets to understand whether performance changes result from operations, customer behavior, or external market conditions.
Key Takeaway
- Door counters measure store entries, POS systems capture transactions, and Mobility Data provides external visitation context.
- Capture rate and transaction conversion measure different stages of the retail customer journey.
- Dwell time, repeat visits, and trade area analysis help explain visitor behavior beyond entry counts.
- Door-counter accuracy depends on sensor technology, installation, crowd density, and measurement conditions.
- Weather, local events, and buy online, pick up in store (BOPIS) transactions can distort traffic-to-sales comparisons.
What Is Storefront Analytics?
Storefront analytics is the process of measuring physical retail performance using foot traffic, transactions, visitor behavior, and location-based market data. It connects internal store activity with external demand to support operational and expansion decisions.
Three datasets form the foundation:
| Data source | What it measures | Primary limitation |
| Door counters | Store entries, footfall, hourly traffic | Cannot identify purchases or external demand |
| POS data | Transactions, revenue, basket size, product sales | Does not capture visitors who leave without purchasing |
| Mobility Data | Estimated visitation, visitor origins, competitive activity | Does not directly measure purchases or exact door entries |
Foot traffic, also called footfall, refers to the volume of visits or entries at a physical location during a defined period. Visitation is a broader term that may describe either directly counted visits or visits estimated from mobility signals.
5 Ways to Combine Door Counters, POS, and Mobility Data
1. Separate Traffic Declines From Conversion Problems
Combining door counters and POS data helps retailers determine whether declining revenue comes from fewer entries, fewer transactions per entry, or lower spending per transaction. Mobility Data adds context about whether nearby locations are experiencing similar traffic changes.
| Metric | Formula | Business question |
| Transaction conversion proxy | Transactions ÷ entries × 100 | How many transactions occur relative to entries? |
| Average transaction value | Revenue ÷ transactions | How much revenue does each transaction generate? |
| Revenue per entry | Revenue ÷ entries | How much revenue is generated relative to traffic? |
A transaction conversion proxy estimates purchasing activity by dividing POS transactions by counted entries; it is not the percentage of unique visitors who purchased.
Consider a store recording 5,000 entries and 1,000 transactions. Its transaction conversion proxy is 20%. If entries increase to 6,000 while transactions remain unchanged, the proxy falls to approximately 16.7%.
This signals a widening traffic-to-transaction gap, not necessarily declining demand. Retailers should investigate staffing, product availability, checkout delays, and the mix of visitors entering the store.
Decision: Determine whether investment should target customer acquisition or in-store conversion.
2. Measure Capture Rate and Local Demand
Capture rate measures the percentage of people passing a storefront who enter the store, calculated as store entries divided by passersby multiplied by 100.
A store receiving 2,000 passersby and 200 entries has a capture rate of 10%. If passing traffic increases but entries remain unchanged, the storefront may be failing to convert additional exposure into visits.
This requires a separate passerby measurement from an exterior-facing sensor or another validated source. Store-level Mobility Data should not automatically be treated as a precise count of people passing the entrance.
Mobility Data can instead help retailers compare broader visitation trends across shopping districts, competing stores, and retail categories.
Decision: Distinguish storefront visibility and attraction problems from declining market activity.
3. Connect Dwell Time, Repeat Visits, and Sales
Dwell time is the duration a visitor spends at a location during a visit. Repeat visitation measures how frequently visitors return to the same location within a defined period.
These metrics help explain why stores with similar footfall can produce different commercial outcomes. Longer dwell time may indicate engagement, but it can also reflect queues, service delays, or browsing without purchasing.
Repeat visits can reveal customer loyalty or recurring location usage. However, conventional door counters cannot reliably identify returning individuals, and repeat-visit estimates depend on the underlying measurement method.
Retailers should compare dwell-time and repeat-visitation patterns with transaction conversion, average transaction value, and store format. A grocery store and a furniture showroom should not be evaluated against identical dwell-time expectations.
Decision: Identify whether changes in visitor engagement correspond with better commercial performance.
4. Account for Weather, Events, and Omnichannel Sales
Weather, local events, and omnichannel fulfillment can change the relationship between store entries and POS transactions. Retailers should account for these factors before attributing performance changes to merchandising or staffing.
NOAA identifies weather as an important influence on retail operations, consumer demand, and inventory planning. Rainfall, extreme temperatures, and severe weather can affect both shopping activity and product demand.
Local events can also create temporary increases in surrounding footfall without producing proportional sales. Comparing event days with ordinary trading periods helps prevent misleading performance benchmarks.
BOPIS creates another measurement problem. A customer may enter only to collect an online purchase, generating footfall without a corresponding in-store POS transaction.
Retailers should separate pickup orders, returns, ship-from-store transactions, and conventional purchases wherever possible.
Decision: Adjust performance benchmarks for external conditions and fulfillment activity before evaluating store teams.
5. Evaluate Trade Areas and Cannibalization Risk
Combining store performance benchmarks with Mobility Data helps retailers assess where demand originates and whether a new location could affect existing stores.
A trade area is the geographic area from which a store attracts customers or visitors. Cannibalization occurs when a new or existing store captures sales or visits that would otherwise have gone to another location within the same retail network.
Door-counter and POS data establish benchmarks for existing stores. Mobility Data adds visitor-origin patterns, competitor locations, and trade area overlap.
| Evaluation factor | Location A | Location B |
| Surrounding visitation | High | Moderate |
| Competitor concentration | High | Moderate |
| Existing trade area overlap | High | Low |
| Primary concern | Cannibalization and competition | Incremental demand potential |
| Next evaluation | Estimate transferred sales | Validate achievable sales |
A high-traffic location may offer strong visibility but substantial overlap with an existing store. A lower-traffic market may offer greater incremental reach.
Retailers should combine these findings with expected conversion, average transaction value, rent, and operating costs before making an expansion decision.
Decision: Prioritize locations based on incremental revenue potential rather than surrounding footfall alone.
Which Door-Counter Technology Works Best?
The best door-counter technology depends on entrance layout, crowd density, measurement requirements, and privacy constraints. No technology has a universal accuracy rate across every store environment.
| Technology | How it works | Strength | Main limitation |
| Infrared beam | Counts interruptions across an entrance | Simple and economical | Can miss people entering side by side |
| Thermal sensor | Detects heat signatures | Works without conventional visible-light imagery | Can struggle with overlapping heat signatures and environmental heat |
| Video AI / 3D vision | Detects and tracks people crossing a counting line | Supports directional counting and more complex entrances | Performance depends on positioning, crowding, and configuration |
| Wi-Fi / Bluetooth | Detects signals from nearby devices | Useful for broader device-presence trends | Device detection is not equivalent to counting people |
For conversion reporting, retailers should validate counter performance against manually observed entries during both normal and peak periods. The most useful accuracy measure is the difference between counted and observed entries under the store’s actual operating conditions.
How Reliable Is Mobility Data for Storefront Analytics?
Mobility Data can reveal visitation patterns, competitive trends, and visitor origins, but its reliability depends on coverage, sampling, and geographic precision. It should be validated against known store activity before being used for performance benchmarking.
| Methodology factor | What to evaluate | Main limitation |
| Coverage | Geographic reach, device availability, observation periods | Some markets and locations may be underrepresented |
| Sampling | Device representation, weighting, extrapolation | Observed devices are not a census of all visitors |
| Spatial precision | Location accuracy, POI boundaries, attribution rules | Nearby businesses may be difficult to distinguish |
| Temporal coverage | Observation frequency, reporting intervals | Short visits or intermittent signals may be missed |
| Visit modeling | Dwell thresholds, visit classification, normalization | Estimated visits may differ from door-counter totals |
A practical validation method is to compare month-over-month changes in internal entries against external visitation estimates across a representative sample of stores.
If the trends diverge consistently, investigate coverage, location boundaries, sampling changes, and visit definitions before using the data for competitive decisions.
Privacy and Compliance in Storefront Analytics
Privacy-safe storefront analytics requires appropriate data collection, lawful processing, and controls over how location information is shared and analyzed. Aggregated reporting alone does not establish that every underlying data-processing activity complies with privacy law.
Under the California Consumer Privacy Act, precise geolocation is classified as sensitive personal information. The California Privacy Protection Agency explains the rights and obligations associated with this category of data.
For GDPR-covered processing, the European Data Protection Board distinguishes anonymized data from pseudonymized data, which can remain personal data.
Retailers evaluating Mobility Data should verify collection permissions, consent or other lawful bases where applicable, aggregation methods, retention periods, and restrictions on identifying individuals. Video and Wi-Fi-based counters also require appropriate privacy assessments.
How Factori Supports Storefront Analytics
Factori provides Mobility Data, Places Data, People Data, and other real-world datasets that help retailers evaluate store performance against surrounding market conditions.
These datasets support competitive visitation analysis, visitor-origin insights, retail location intelligence, and retail site selection.
Through APIs, cloud delivery, and the Factori Platform, organizations can incorporate external location intelligence into existing POS, store performance, and analytical workflows.
Conclusion
Storefront analytics is most effective when retailers connect internal measurements with external market context.
Door counters reveal footfall, POS systems measure commercial outcomes, and Mobility Data helps explain competitive activity, visitor origins, and trade area demand. Capture rate, transaction conversion, dwell time, and repeat visitation provide additional context for diagnosing performance.
The goal is to identify whether a store needs operational improvements, stronger demand generation, or a different location strategy.
FAQs
What Is a Good Retail Conversion Rate?
A good retail conversion rate depends on the store format, product category, location, and customer purchasing behavior. There is no universal benchmark that applies to every retail business.
Retailers should compare transaction conversion rates against their historical performance and similar stores. Consistent improvements in conversion, average transaction value, and revenue per entry are more useful than targeting a generic industry average.
What Is the Difference Between Door-Counter Data and Mobility Data?
Door-counter data measures entries into a physical store using sensors installed at entrances. Mobility Data uses location signals to estimate visitation patterns, visitor origins, and activity across geographic areas.
Door counters are better suited for measuring internal footfall and calculating transaction conversion. Mobility Data provides external context for competitive benchmarking, trade area analysis, and retail site selection.
How Accurate Is Mobility Data?
Mobility Data accuracy depends on device coverage, sampling methods, location precision, visit attribution, and statistical modeling. There is no single accuracy percentage that applies across all providers or locations.
Retailers should validate estimated visitation against door-counter records where available. They should also assess geographic coverage, temporal consistency, and whether the methodology can reliably distinguish nearby storefronts.
Is Mobility Data Privacy-Compliant?
Mobility Data can be processed in compliance with privacy regulations such as GDPR and CCPA when appropriate legal, technical, and organizational safeguards are in place. Compliance depends on how location information is collected, processed, shared, and retained.
Buyers should evaluate consent or other applicable lawful bases, data aggregation, anonymization methods, retention policies, and restrictions on individual identification. Aggregation alone does not automatically establish regulatory compliance.
What Is Capture Rate in Retail Analytics?
Capture rate is the percentage of people passing a storefront who enter the store. It measures how effectively a retail location converts passing foot traffic into store visits.
Capture rate is calculated as:
Capture Rate = (Store Entries ÷ Passerby Traffic) × 100
For example, if 2,000 people pass a storefront and 200 enter, the capture rate is 10%. Retailers use this metric to evaluate storefront visibility, window displays, local marketing, and the ability to attract nearby shoppers.