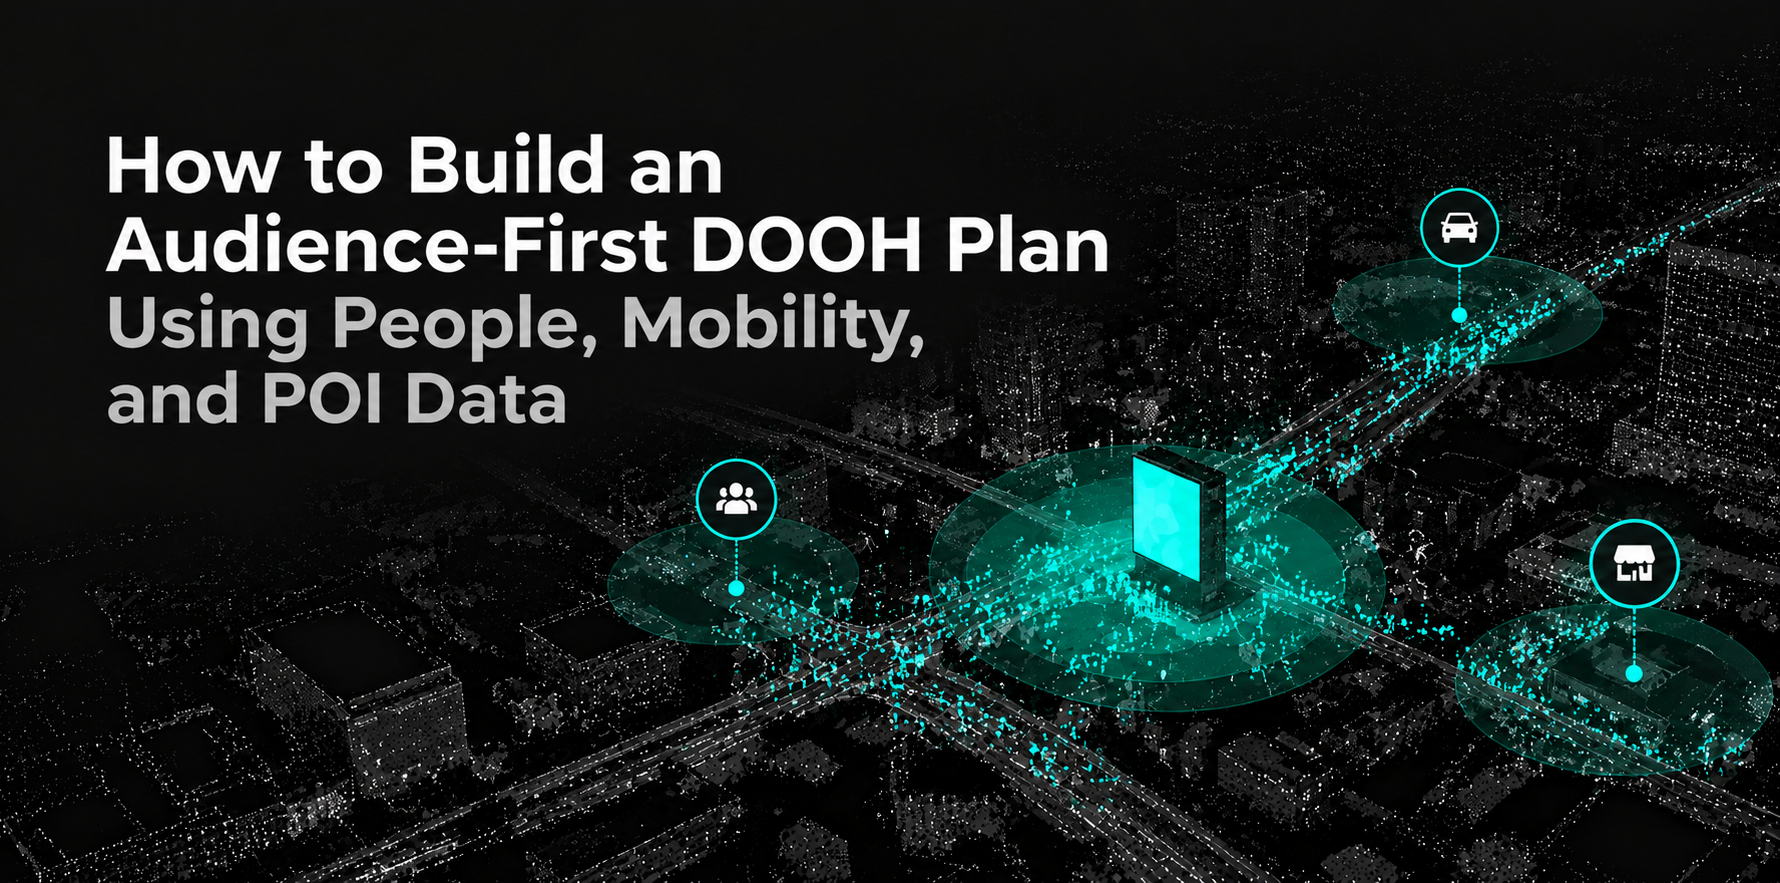
A DOOH screen can sit on a busy road, inside a crowded mall, or beside a major transit hub and still be the wrong placement for a campaign. High traffic tells you that people are present. It does not tell you whether the right audience is present.
Audience-first DOOH planning starts from the consumer rather than the screen. By combining People Data, mobility patterns, POI context, and visit signals, media teams can move from “Which screens have the most traffic?” to “Which locations give this campaign the strongest opportunity to reach the audience that matters?”
Key Takeaway
- Audience-first DOOH planning begins with the target audience, not available inventory.
- People Data helps define and size the audience before locations are evaluated.
- Mobility data shows where and when relevant audiences move through physical markets.
- POI data explains the commercial and geographic context around potential DOOH locations.
- These signals should be used together to rank inventory, then validated against campaign objectives and measurement requirements.
Start With the Audience, Not the Screen
Traditional OOH planning often starts with available inventory.
A planner reviews screens by market, location, estimated impressions, format, or traffic volume, then decides which ones appear suitable.
Audience-first planning reverses that process.
Start with:
Who does the campaign need to reach?
For a premium fitness brand, that might be:
Higher-income adults aged 25–44 who fit a health and wellness profile in Los Angeles.
The next questions become:
- How large is that audience?
- Where is it concentrated?
- Which locations do relevant groups visit?
- Which routes and districts show strong movement?
- When is the audience most likely to be present?
- Which DOOH screens intersect with those patterns?
This turns inventory selection into an audience-location problem rather than a traffic-volume problem.
Build and Size the Target Audience First
Before evaluating screens, planners need a usable audience definition.
People Data can add demographic, household, financial, lifestyle, work, and geographic context to the campaign brief. Instead of targeting a broad group such as “adults in Los Angeles,” teams can define an audience that more closely reflects the campaign objective.
For example:
Los Angeles residents + age 25–44 + selected household-income range + relevant lifestyle characteristics
The audience should then be sized before the media plan is built.
This matters because additional criteria create a trade-off between precision and scale. A highly specific audience may look attractive but become too small to support the intended campaign.
Factori Audience Studio supports this step by allowing teams to describe an audience in plain English or build it with structured filters, then review its size and geographic distribution.
The workflow becomes:
Define → Size → Refine → Map
Current Audience Studio People and Audience coverage is focused on U.S. consumer audiences.
Map Where the Audience Is Concentrated
Once an audience is defined, the next question is not simply how many people match.
It is:
Where are they?
Two metro areas may contain the same number of matching consumers but have very different spatial patterns.
In one market, the audience may cluster around a small number of neighborhoods and commercial corridors. In another, it may be spread across a much wider area.
That difference affects DOOH planning.
Audience Studio provides a geographic view alongside the audience definition, helping teams identify where relevant audiences are concentrated before they begin evaluating individual screens.
This gives planners an initial geographic priority layer.
But where people live is only one part of the problem.
Use Mobility Data to Understand Where the Audience Moves
A residential concentration map does not necessarily show where an audience spends its day.
People commute, shop, exercise, eat, travel, and spend time across different parts of a market.
Mobility data helps add that movement layer.
For DOOH planning, mobility signals can help answer:
- Which corridors experience consistent movement?
- How does activity change by day or daypart?
- Which areas receive repeat traffic?
- Where do movement patterns connect residential and commercial areas?
- Which potential OOH locations sit along meaningful routes?
This distinction matters because a screen may have significant total traffic without being positioned along the movement patterns most relevant to the campaign audience.
Audience concentration identifies where to start looking.
Mobility helps explain how activity moves through that market.
Add POI Context Before Ranking DOOH Locations
A screen does not exist in isolation.
Its surrounding environment affects who is likely to be nearby and why.
POI data adds context around potential placements by showing nearby:
- stores
- restaurants
- gyms
- offices
- malls
- hotels
- entertainment venues
- transit locations
- competing brands
- category clusters
Consider two screens with similar movement levels.
Screen A sits near office buildings, business hotels, and premium restaurants.
Screen B sits near universities, quick-service restaurants, and entertainment venues.
The traffic volume may be similar, but the environments suggest different audience missions and campaign relevance.
POI data therefore helps planners move beyond how much activity exists to understand what kind of environment generates that activity.
Resident and Visitor Audiences Can Lead to Different Plans
Not every DOOH campaign should be planned around residents.
Sometimes the relevant audience is defined by visitation.
Consider a premium athletic brand.
One strategy could target people who live in affluent neighborhoods.
Another could focus on audiences associated with premium gyms, sports facilities, running stores, or competing athletic retailers.
These approaches answer different questions.
Resident audience:
Where do people matching the target profile live?
Visitor audience:
Which places are associated with the real-world behavior relevant to the campaign?
Audience Studio supports both Residents and Visitors as starting points for audience creation. Those audiences can then be refined using available People Data criteria.
For DOOH planners, visitor-based audiences can be especially useful when the campaign is tied to a category, destination, competitor set, or real-world activity.
Combine the Signals Into a DOOH Location Score
The next step is to compare potential inventory using multiple signals.
A useful evaluation framework could look like this:
| Signal | Question it answers |
| Audience concentration | Are enough relevant consumers present in this market? |
| Mobility | Is there meaningful movement around the location? |
| Repeat activity | Is the area visited regularly or occasionally? |
| Daypart patterns | When does relevant activity peak? |
| POI context | What types of places surround the screen? |
| Relevant visits | Is the location connected to category or destination activity? |
| Competitive context | What brands and venues compete for attention nearby? |
| Geographic fit | Does the screen sit inside the campaign’s priority market? |
The objective is not to create one universal DOOH score.
The weighting should change based on the campaign.
A commuter campaign may place greater weight on repeated weekday movement. A luxury retailer may prioritize audience fit and premium POI context. A QSR campaign may care more about daypart movement and proximity to locations.
High Foot Traffic Does Not Automatically Mean High Audience Fit
This is one of the most important distinctions in audience-first planning.
Suppose:
Screen A:
1 million monthly passersby, but only a small share aligns with the target audience.
Screen B:
600,000 monthly passersby, but a much stronger concentration of the target audience and better proximity to relevant destinations.
Screen A wins on volume.
Screen B may be more relevant to the campaign.
That does not automatically mean Screen B will perform better. Creative, frequency, pricing, inventory quality, campaign objectives, and many other factors still matter.
But real-world data gives planners more evidence than traffic volume alone.
Plan for Measurement Before the Campaign Runs
Audience-first planning should not stop at screen selection.
Teams should decide in advance how the campaign will be evaluated.
Possible metrics include:
- audience reach
- frequency
- relevant location exposure
- store visits
- incremental visit lift
- cost per visit
- market-level visitation change
The World Out of Home Organization’s 2026 audience-measurement guidance reflects the industry’s increasing use of continuously collected mobility data and third-party datasets in OOH measurement.
For store-visit measurement, campaign lift should not be inferred from a simple increase in post-campaign foot traffic. Seasonality, promotions, market conditions, store differences, and other factors may also affect visitation.
A stronger design establishes the baseline and measurement methodology before the campaign launches.
Where Audience Studio Fits
Factori Audience Studio provides the audience-definition layer within this process.
Teams can define a Resident or Visitor audience, refine it using People Data attributes, review audience size, and see its geographic concentration before evaluating DOOH locations.
The workflow can then continue with mobility, visit, and POI signals:
Build Audience → Map Audience → Analyze Movement → Add POI Context → Evaluate Inventory → Measure Outcomes
Audience Studio does not replace DOOH buying or inventory platforms. It helps teams define and understand the audience that should guide those downstream planning decisions.
What to Evaluate When Using Data for Audience-First DOOH
Before using an external dataset for DOOH planning, buyers should evaluate more than coverage claims.
Look at:
Geographic coverage: Does the data perform well in the campaign markets?
Freshness: How often are mobility, visits, places, and audience attributes updated?
POI accuracy: Are relevant locations correctly categorized and maintained?
Audience methodology: Which attributes are observed, modeled, inferred, or derived?
Temporal depth: Can patterns be evaluated across weeks, months, and dayparts?
Joinability: Can People, Mobility, Visit, and POI signals be connected consistently at the geography or location level needed for planning?
Privacy: Are mobility and audience signals handled in an aggregated and privacy-safe way with transparent sourcing and appropriate controls?
The best data source is not necessarily the one with the most signals. It is the one that provides enough reliable context to improve the media decision.
Conclusion
Audience-first DOOH planning changes the starting point.
Instead of finding a busy screen and asking who might see it, teams first define the audience they want to reach and then identify the places, movement patterns, and DOOH locations that align with that audience.
People Data helps define who matters. Audience Studio helps size and map that audience. Mobility shows where and when activity happens. POI data explains what surrounds each potential placement.
Together, these signals give planners a stronger basis for deciding which DOOH locations deserve campaign budget.
FAQs
Is audience-first DOOH planning only useful for programmatic DOOH?
No. The same audience, movement, and location signals can support both programmatic and directly purchased OOH or DOOH inventory.
Can mobility data identify the best DOOH screen by itself?
No. Mobility can show activity and movement patterns, but screen evaluation should also consider audience fit, POI context, inventory characteristics, pricing, campaign objectives, and measurement requirements.
How can POI data improve DOOH planning?
POI data explains the physical environment around a placement. It can reveal nearby stores, competitors, offices, transit hubs, restaurants, entertainment venues, and other locations that provide context for why people are present.
Should DOOH planners use residents or visitors to define an audience?
It depends on the campaign. Resident audiences are useful when the target is tied to where people live, while visitor audiences can be more relevant when targeting is based on interactions with particular places, categories, or destinations.
Can audience data prove that someone will respond to a DOOH ad?
No. Audience and real-world data provide signals that can improve planning and targeting. They do not prove individual intent, future behavior, or campaign response.