Commercial real estate data can describe a property in remarkable detail. Ownership, building characteristics, leases, rents, vacancy, transactions, financing, and comparable assets all help teams understand what they are evaluating.
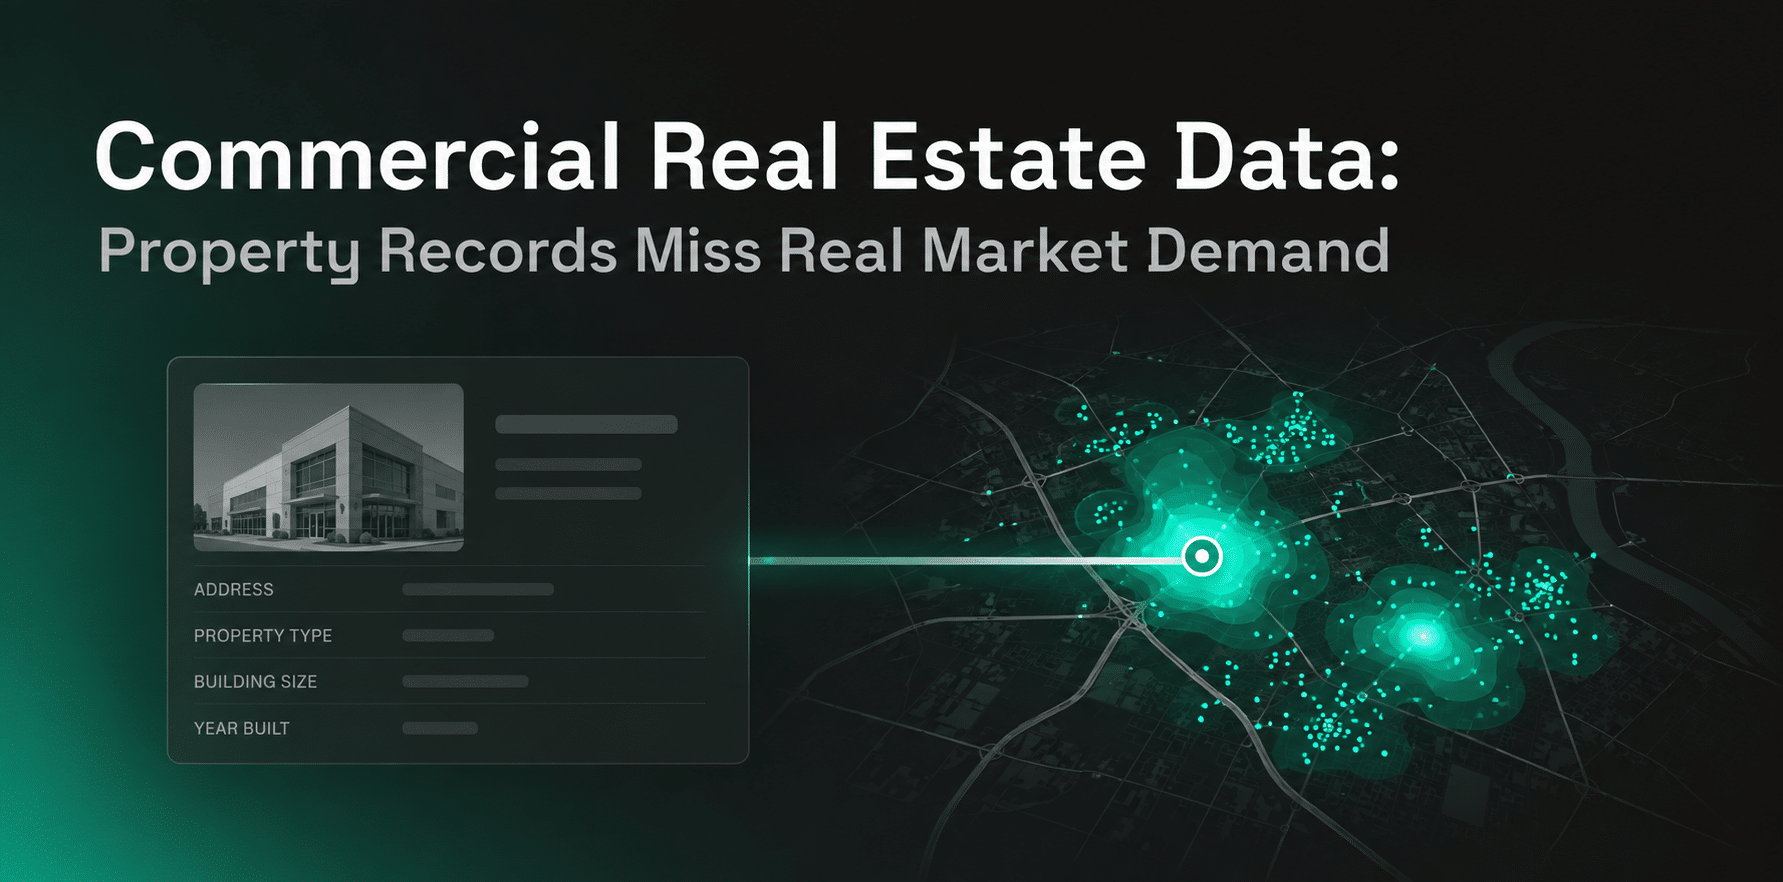
But property records do not always explain the demand surrounding an asset. Two properties with similar fundamentals can perform differently because employment, population, visitor activity, accessibility, nearby businesses, and movement patterns are changing in different ways.
Key Takeaway
- Real estate data services can include property, transaction, market, mobility, demographic, economic, and location datasets.
- Traditional property data explains the asset, while external real-world data can help explain the demand surrounding it.
- Different providers specialize in different parts of the real estate data stack.
- Mobility, POI, demographic, business, and economic data can add context to underwriting, site selection, market analysis, and portfolio strategy.
- External signals should be validated against actual property outcomes before they influence investment decisions.
What Are Real Estate Data Services?
Real estate data services provide structured information that investors, developers, brokers, owners, analysts, and data teams use to evaluate properties and markets.
Traditional real estate data providers often focus on property-level information such as ownership, parcels, transactions, mortgages, valuations, taxes, deeds, building characteristics, and listings.
Commercial real estate analysis can require another layer. Mobility, foot traffic, nearby businesses, demographics, economic activity, accessibility, and visitor origins can help explain what is happening around the property.
Property data answers questions about the asset itself. Real-world and location data help answer questions about the market and demand environment surrounding it.
What Types of Real Estate Data Services Are Available?
Different real estate data services support different parts of the decision process.
| Data service | Typical information | Common use |
|---|---|---|
| Property data | Parcel, ownership, building attributes, zoning | Asset research and underwriting |
| Transaction data | Sales, buyers, sellers, mortgages, comparable transactions | Valuation and acquisition analysis |
| Leasing and market data | Rent, vacancy, absorption, supply | Market and asset performance |
| Places and business data | Businesses, amenities, competitors, tenants | Neighborhood and competitive analysis |
| Mobility and foot traffic data | Visits, movement, visitor origins | Retail CRE and location analysis |
| People and demographic data | Population and audience characteristics | Market and trade area analysis |
| Economic data | Employment, income, business activity | Market screening and demand analysis |
| Geospatial data | Coordinates, boundaries, roads, catchments | GIS and spatial analysis |
No single commercial real estate dataset answers every investment question. The strongest analysis usually combines the data describing the asset with information describing the market around it.
Real Estate Data Providers and What They Specialize In
The term real estate data provider covers companies with very different offerings. Some specialize in property records and ownership, while others focus on market intelligence, mobility, or real-world location data.
| Provider | Primary focus | Useful for |
|---|---|---|
| Factori | Places, Mobility, People, Business, Economic, Events, Property and other real-world datasets | Market demand, site analysis, foot traffic, trade areas and external market intelligence |
| ATTOM | Property, ownership, mortgage and transaction data | Property research, valuation, lending and real estate analytics |
| Cotality | Property, valuation, risk and market intelligence | Property analysis, mortgage, insurance and market research |
| BatchData | Property, ownership, valuation and real estate APIs | Property enrichment, ownership research and data applications |
| First American Data & Analytics | Property records, ownership and recorded documents | Property research, title-related analysis and due diligence |
| Placer.ai | Location analytics and visitation intelligence | Foot traffic, commercial location analysis and market benchmarking |
These providers are not interchangeable.
A team researching ownership and deeds may prioritize a property-record provider. A commercial real estate team evaluating whether a retail center has a strong surrounding demand base may need mobility, POI, demographic, and market signals instead.
Property Records Can Describe the Asset Without Explaining Demand
Traditional commercial real estate data answers important questions: What is the building? Who owns it? What did comparable properties sell for? What rents are being achieved? Who occupies the space?
Those questions are fundamental to underwriting. The gap appears when teams move from describing the asset to estimating what could support future demand.
Consider two retail properties with similar square footage, occupancy, asking rents, and comparable transactions. One may sit inside an increasingly active commercial corridor with growing visitation and strong customer inflows. The other may depend on a weakening catchment with declining surrounding activity.
The property records may look similar. The demand environment does not.
This distinction also matters during real estate site selection, where an attractive property still needs enough accessible demand around it to support the investment.
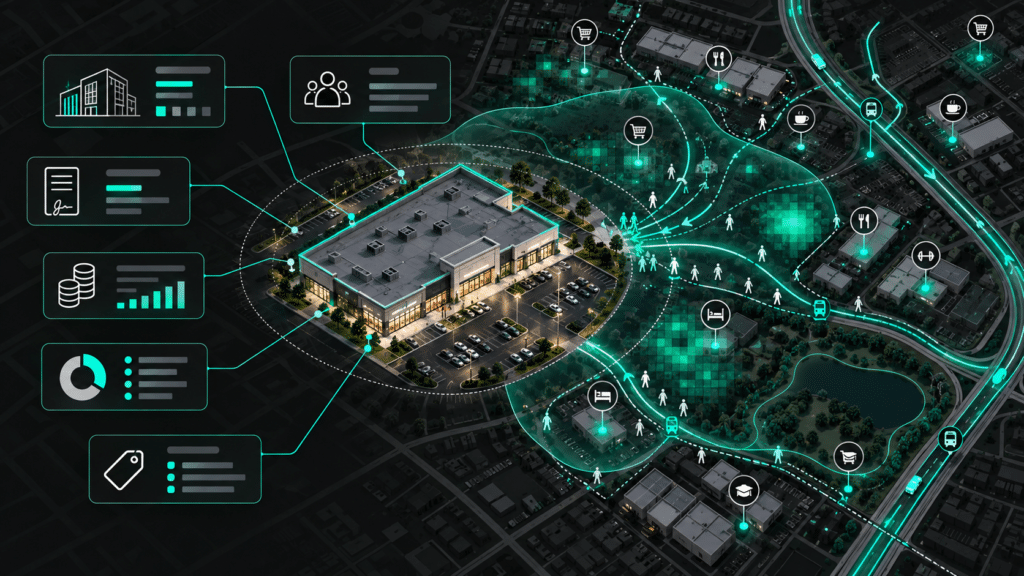
A stronger CRE analysis separates the data describing the asset from the data describing what is happening around it.
| Data layer | Examples | What it helps answer |
|---|---|---|
| Asset | Building size, parcel, ownership, zoning | What are we evaluating? |
| Transaction | Sale price, financing, comparables | How has the market priced similar assets? |
| Leasing | Rent, vacancy, tenants, absorption | How is property performance changing? |
| Economic | Jobs, population, industry growth | What structural forces may influence demand? |
| Real-world activity | Visits, movement, trade areas, nearby places | How are people and places interacting now? |
The layers complement one another. Property data explains the asset, market data explains historical and current performance, and real-world data adds evidence about conditions that may affect what happens next.
How Commercial Real Estate Data Is Used
Acquisition and Underwriting
Property, transaction, rent, and comparable data establish the asset and pricing context. External demand signals can then test whether the assumptions behind the investment match what is happening around the location.
Market Selection
Employment, population, business density, accessibility, mobility, and commercial activity can help teams compare markets before individual properties are shortlisted.
Site Selection
Property characteristics can be combined with POI data, demographics, accessibility, mobility, and visitor patterns to understand how a location interacts with its surrounding market.
Asset Management
Occupancy, rent rolls, leasing activity, and tenant performance explain what is happening inside an asset. Changes in foot traffic, surrounding businesses, or local movement can provide additional context when performance starts to change.
Portfolio Strategy
Consistent property, market, and demand indicators allow teams to compare assets across markets and identify locations where risk or opportunity may be emerging.
Demand Can Move Before Property Metrics Do
Vacancy, rent growth, leasing activity, absorption, and transaction volume remain essential CRE indicators. But these metrics may confirm a change after the underlying demand environment has already begun to shift.
The relevant demand signals also change by property type.
| Property type | Demand signals that may matter |
|---|---|
| Office | Employment, commuting, workforce accessibility |
| Industrial | Manufacturing, transportation, warehousing, logistics access |
| Retail | Foot traffic, trade areas, employment, nearby businesses |
| Multifamily | Population growth, migration, employment, amenities |
For retail assets, for example, foot traffic analytics can show whether activity around a property is increasing, declining, seasonal, or shifting toward competing destinations.
These signals should complement established property metrics rather than replace them.
Build a Four-Layer CRE Decision Stack
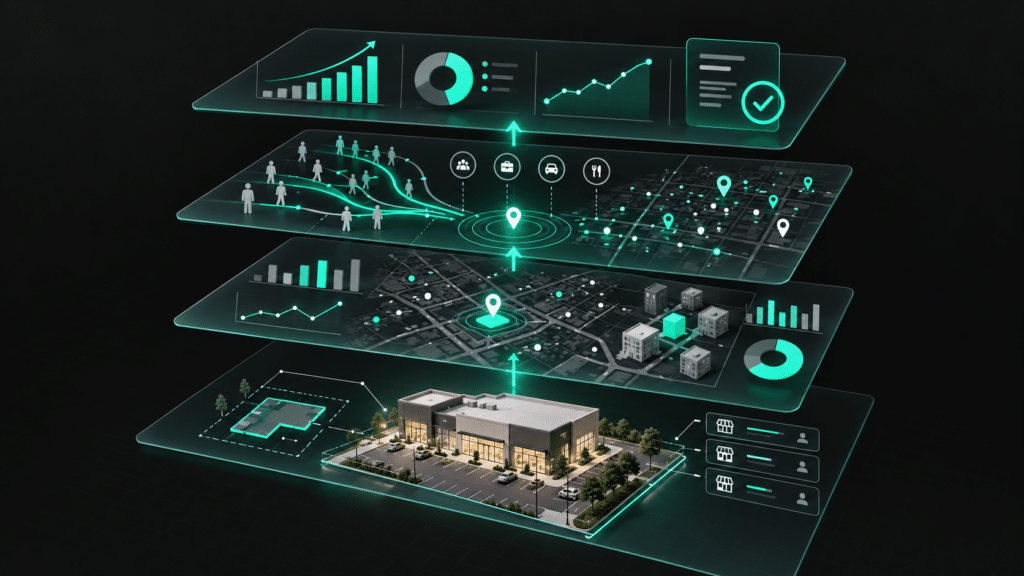
A practical commercial real estate data strategy can be organized around four questions.
1. Asset: What Are We Evaluating?
Start with property characteristics, parcels, ownership, leases, tenants, zoning, physical condition, and other asset-level information.
2. Market: How Is the Property Market Behaving?
Evaluate rents, vacancy, absorption, supply, transactions, financing, and comparable assets.
3. Demand: What Is Happening Around the Property?
Add employment, population, nearby businesses, accessibility, movement, visitation, and other signals that may explain future demand.
Mobility data can show how people move between locations, while POI data helps structure the commercial environment surrounding an asset.
4. Validation: Did the Signals Improve the Decision?
Compare the original investment hypothesis with later occupancy, rent, NOI, leasing velocity, tenant performance, or asset value.
A signal deserves continued weight only if it consistently improves the decisions or forecasts that matter.
Validate External Real Estate Data Before Using It
Not every external signal represents the same thing.
An input may be observed, such as a property coordinate or recorded event; estimated, such as visitation derived from a sample; modeled, such as a demand forecast; or indexed, where activity is measured relative to a benchmark.
Teams should also test whether the geography is appropriate, whether the data existed at the time of the decision, and whether it adds information beyond the existing property and market-data baseline.
The objective is not to add more variables. It is to identify the external data that meaningfully improves investment ranking, forecasting, risk assessment, or site selection.
Factori for Real Estate Data and Market Intelligence
Factori provides real-world datasets that commercial real estate teams can use alongside traditional property records to better understand markets, locations, and demand.
Factori’s data includes Places, Mobility, People, Business, Economic, Events, Property, Audience, and other real-world layers. These datasets can support analysis of surrounding businesses, visitor activity, trade areas, demographic characteristics, market conditions, and changes in local demand.
For example, traditional property data may describe the size, ownership, tenants, and physical characteristics of a shopping center. Factori’s Places and Mobility data can add context about surrounding businesses, competitive destinations, visitation patterns, and where visitors are coming from.
| Traditional CRE data | Factori external data | Combined analysis |
|---|---|---|
| Property characteristics | Places and surrounding businesses | Understand the commercial environment |
| Rent and occupancy | Mobility and visitation | Compare asset performance with activity |
| Tenant records | Business and POI data | Evaluate tenant and competitor context |
| Market reports | Economic and People data | Add local demand context |
| Historical performance | Events and mobility signals | Investigate external changes |
Factori processes more than 90B daily location signals across 150+ countries and provides access to real-world datasets through APIs, bulk data, cloud integrations, the Factori Platform, and MCP workflows.
The goal is not to replace traditional commercial real estate databases. Factori provides an external real-world data layer that can be joined with property, leasing, transaction, tenant, and financial data already used inside the organization.
Make Real Estate Data Work Inside the Enterprise Stack
Commercial real estate data is only useful at scale when teams can consistently connect it with their existing records.
Stable identifiers, address normalization, geocoding, spatial joins, historical availability, refresh cadence, schema consistency, APIs, cloud delivery, and data lineage all affect whether a dataset can support repeatable analysis.
For teams building their own GIS, BI, warehouse, forecasting, or AI workflows, this integration layer can matter as much as the data itself.
Conclusion
Commercial real estate data services cover much more than property records. Ownership, transactions, leases, and valuations describe the asset, while mobility, places, demographics, business activity, and economic data can help explain the demand surrounding it.
The right provider depends on the question being answered. Property databases may be strongest for ownership and transaction research, while real-world data providers such as Factori can add location and demand context to existing CRE analysis.
The strongest data strategy connects both sides: what the property is and what is happening around it.
FAQs
What Are Real Estate Data Services?
Real estate data services provide structured property, ownership, transaction, market, location, demographic, economic, and mobility information used by investors, developers, brokers, analysts, and other real estate teams.
Who Are Some Real Estate Data Providers?
Real estate data providers include companies such as Factori, ATTOM, Cotality, BatchData, First American Data & Analytics, and Placer.ai. Their offerings differ, ranging from property and ownership records to mobility, foot traffic, location, and market intelligence.
What Is Commercial Real Estate Data?
Commercial real estate data includes information about properties, transactions, leases, tenants, rents, vacancy, markets, demographics, businesses, mobility, and other factors used to evaluate commercial assets and locations.
What Data Should CRE Teams Use Beyond Property Records?
Depending on the asset and decision, teams can use employment, demographics, POI, mobility, foot traffic, accessibility, visitor origins, trade areas, and economic data alongside traditional property and transaction information.
How Does Factori Support Commercial Real Estate Analysis?
Factori provides Places, Mobility, People, Business, Economic, Property, Events, and other real-world datasets that can be combined with existing property records. These layers help CRE teams analyze surrounding businesses, visitor activity, market demand, trade areas, and location conditions.