Financial firms rely on earnings reports, filings, market prices, and economic releases to understand performance. These sources remain essential, but they often confirm what has already happened.
Alternative data adds another layer. It gives hedge funds, asset managers, lenders, private equity firms, and research teams external signals that can help them track demand, business activity, consumer behavior, and market conditions between reporting periods.
Key Takeaway
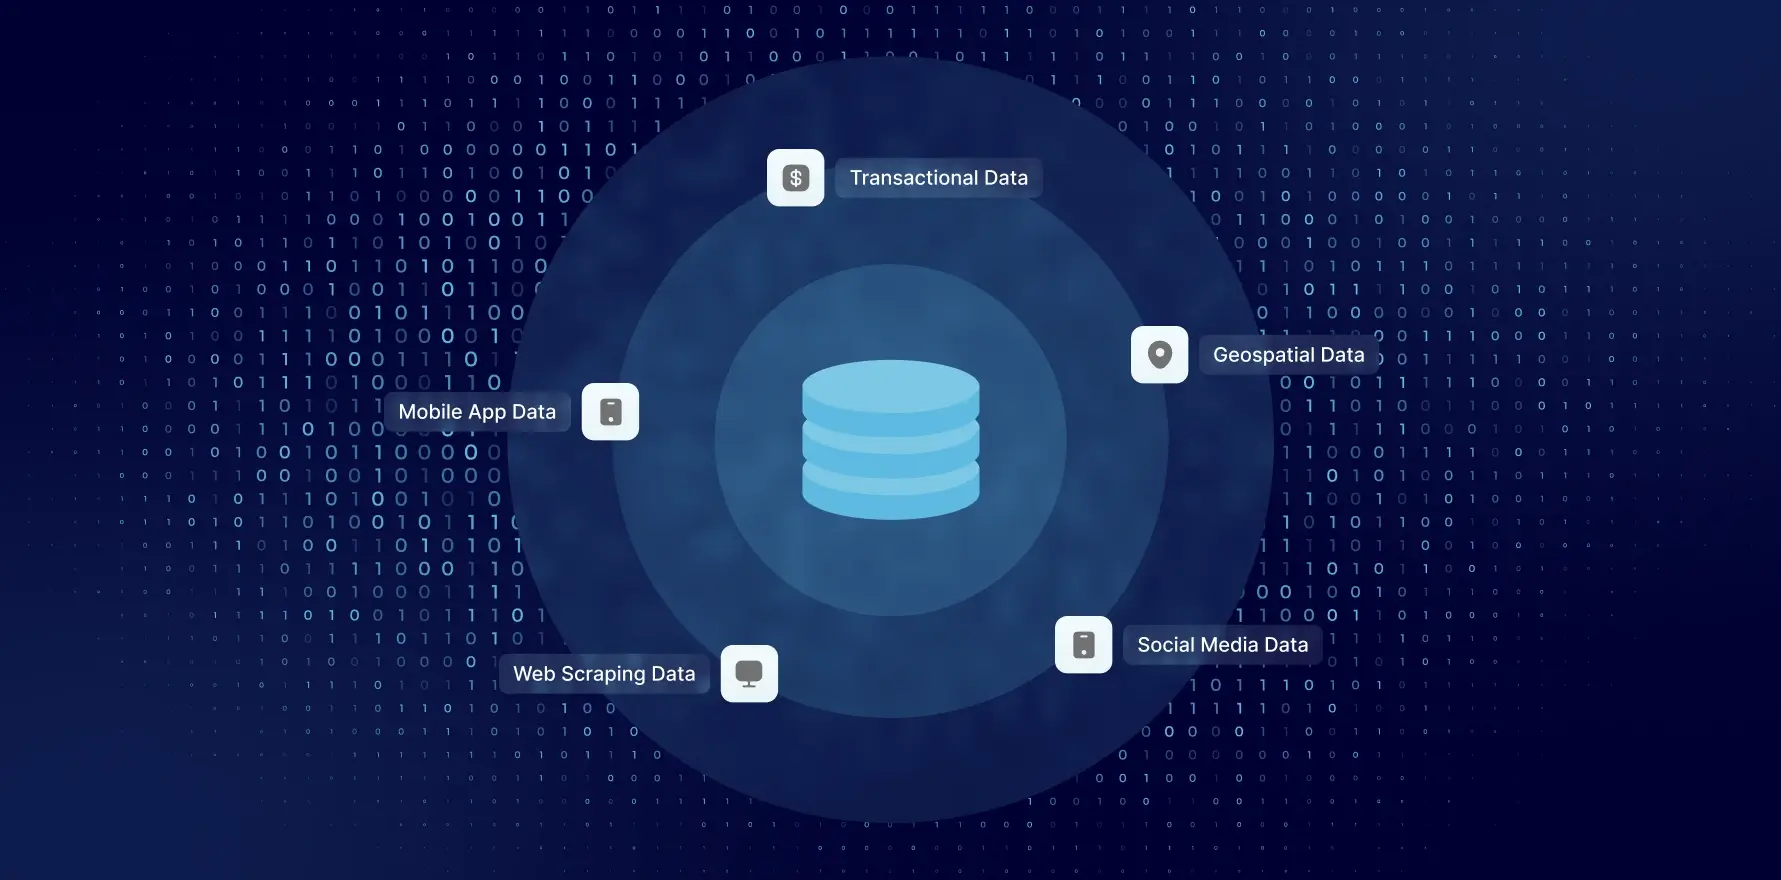
- Alternative data comes from nontraditional sources such as mobility, transactions, web activity, POI data, events, property, and economic signals.
- Finance teams use it for equity research, forecasting, private equity due diligence, credit analysis, and market monitoring.
- Alternative data should complement traditional financial data rather than replace it.
- Observed, derived, and modeled signals should not be treated as equivalent.
- Backtests need leakage-safe joins based on when the information was actually available.
- The value of an alternative dataset should be measured by whether it improves a decision or model, not by how many signals it contains.
What Is Alternative Data in Finance?
Alternative data refers to external datasets that are not part of traditional financial reporting. These datasets may describe physical activity, consumer demand, businesses, digital behavior, transactions, markets, or other real-world conditions.
For example, changes in store visitation may provide additional context around a retailer before quarterly results are released. Business openings, local economic conditions, events, or spending signals may also help analysts understand why demand is changing.
Alternative data does not replace financial statements. It helps financial teams test whether real-world activity supports or challenges the view created from traditional sources.
Alternative Data vs. Traditional Data
Traditional and alternative data answer different questions.
| Area | Traditional data | Alternative data |
|---|---|---|
| Typical sources | Financial statements, filings, market data, government statistics | Mobility, transactions, POI, web, events, property, consumer and business data |
| Update cycle | Often monthly, quarterly, or annually | Can update daily, weekly, or near real time |
| Primary purpose | Confirm reported performance | Track current activity and detect change |
| Structure | Usually standardized | Can require normalization and modeling |
| Main challenge | Reporting lag | Quality, bias, joins, licensing, and validation |
The strongest financial analysis usually combines both.
Types of Alternative Data Used in Finance
Alternative data is not one dataset. Different signals answer different financial questions.
Mobility and Foot Traffic Data
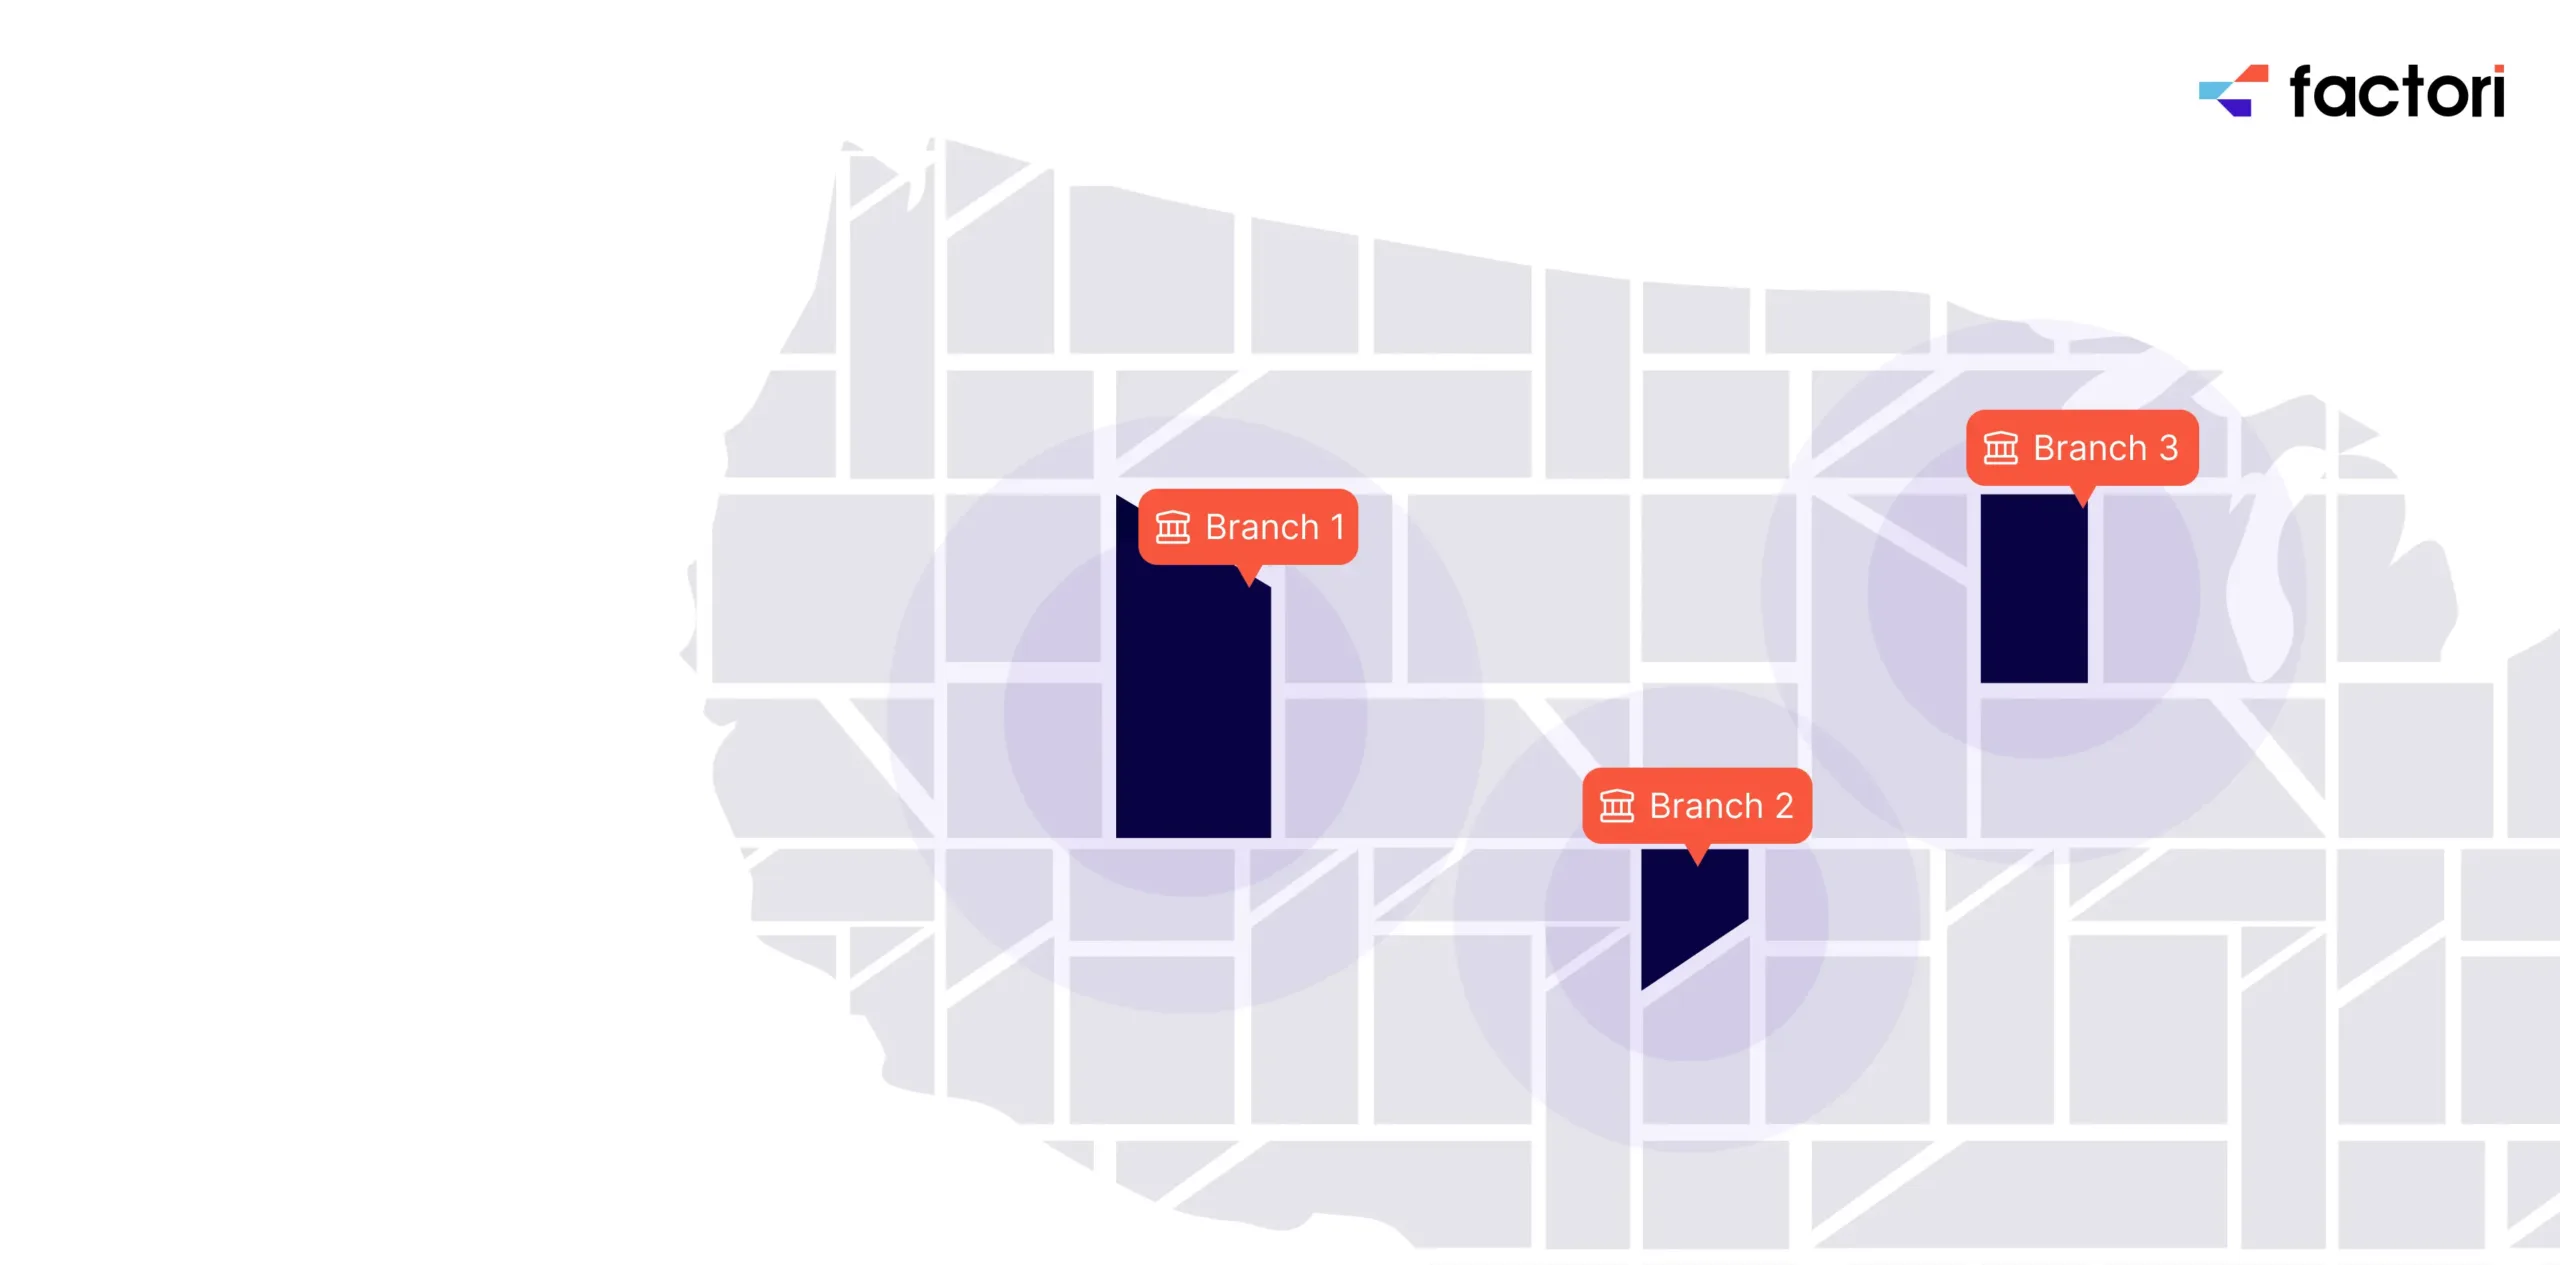
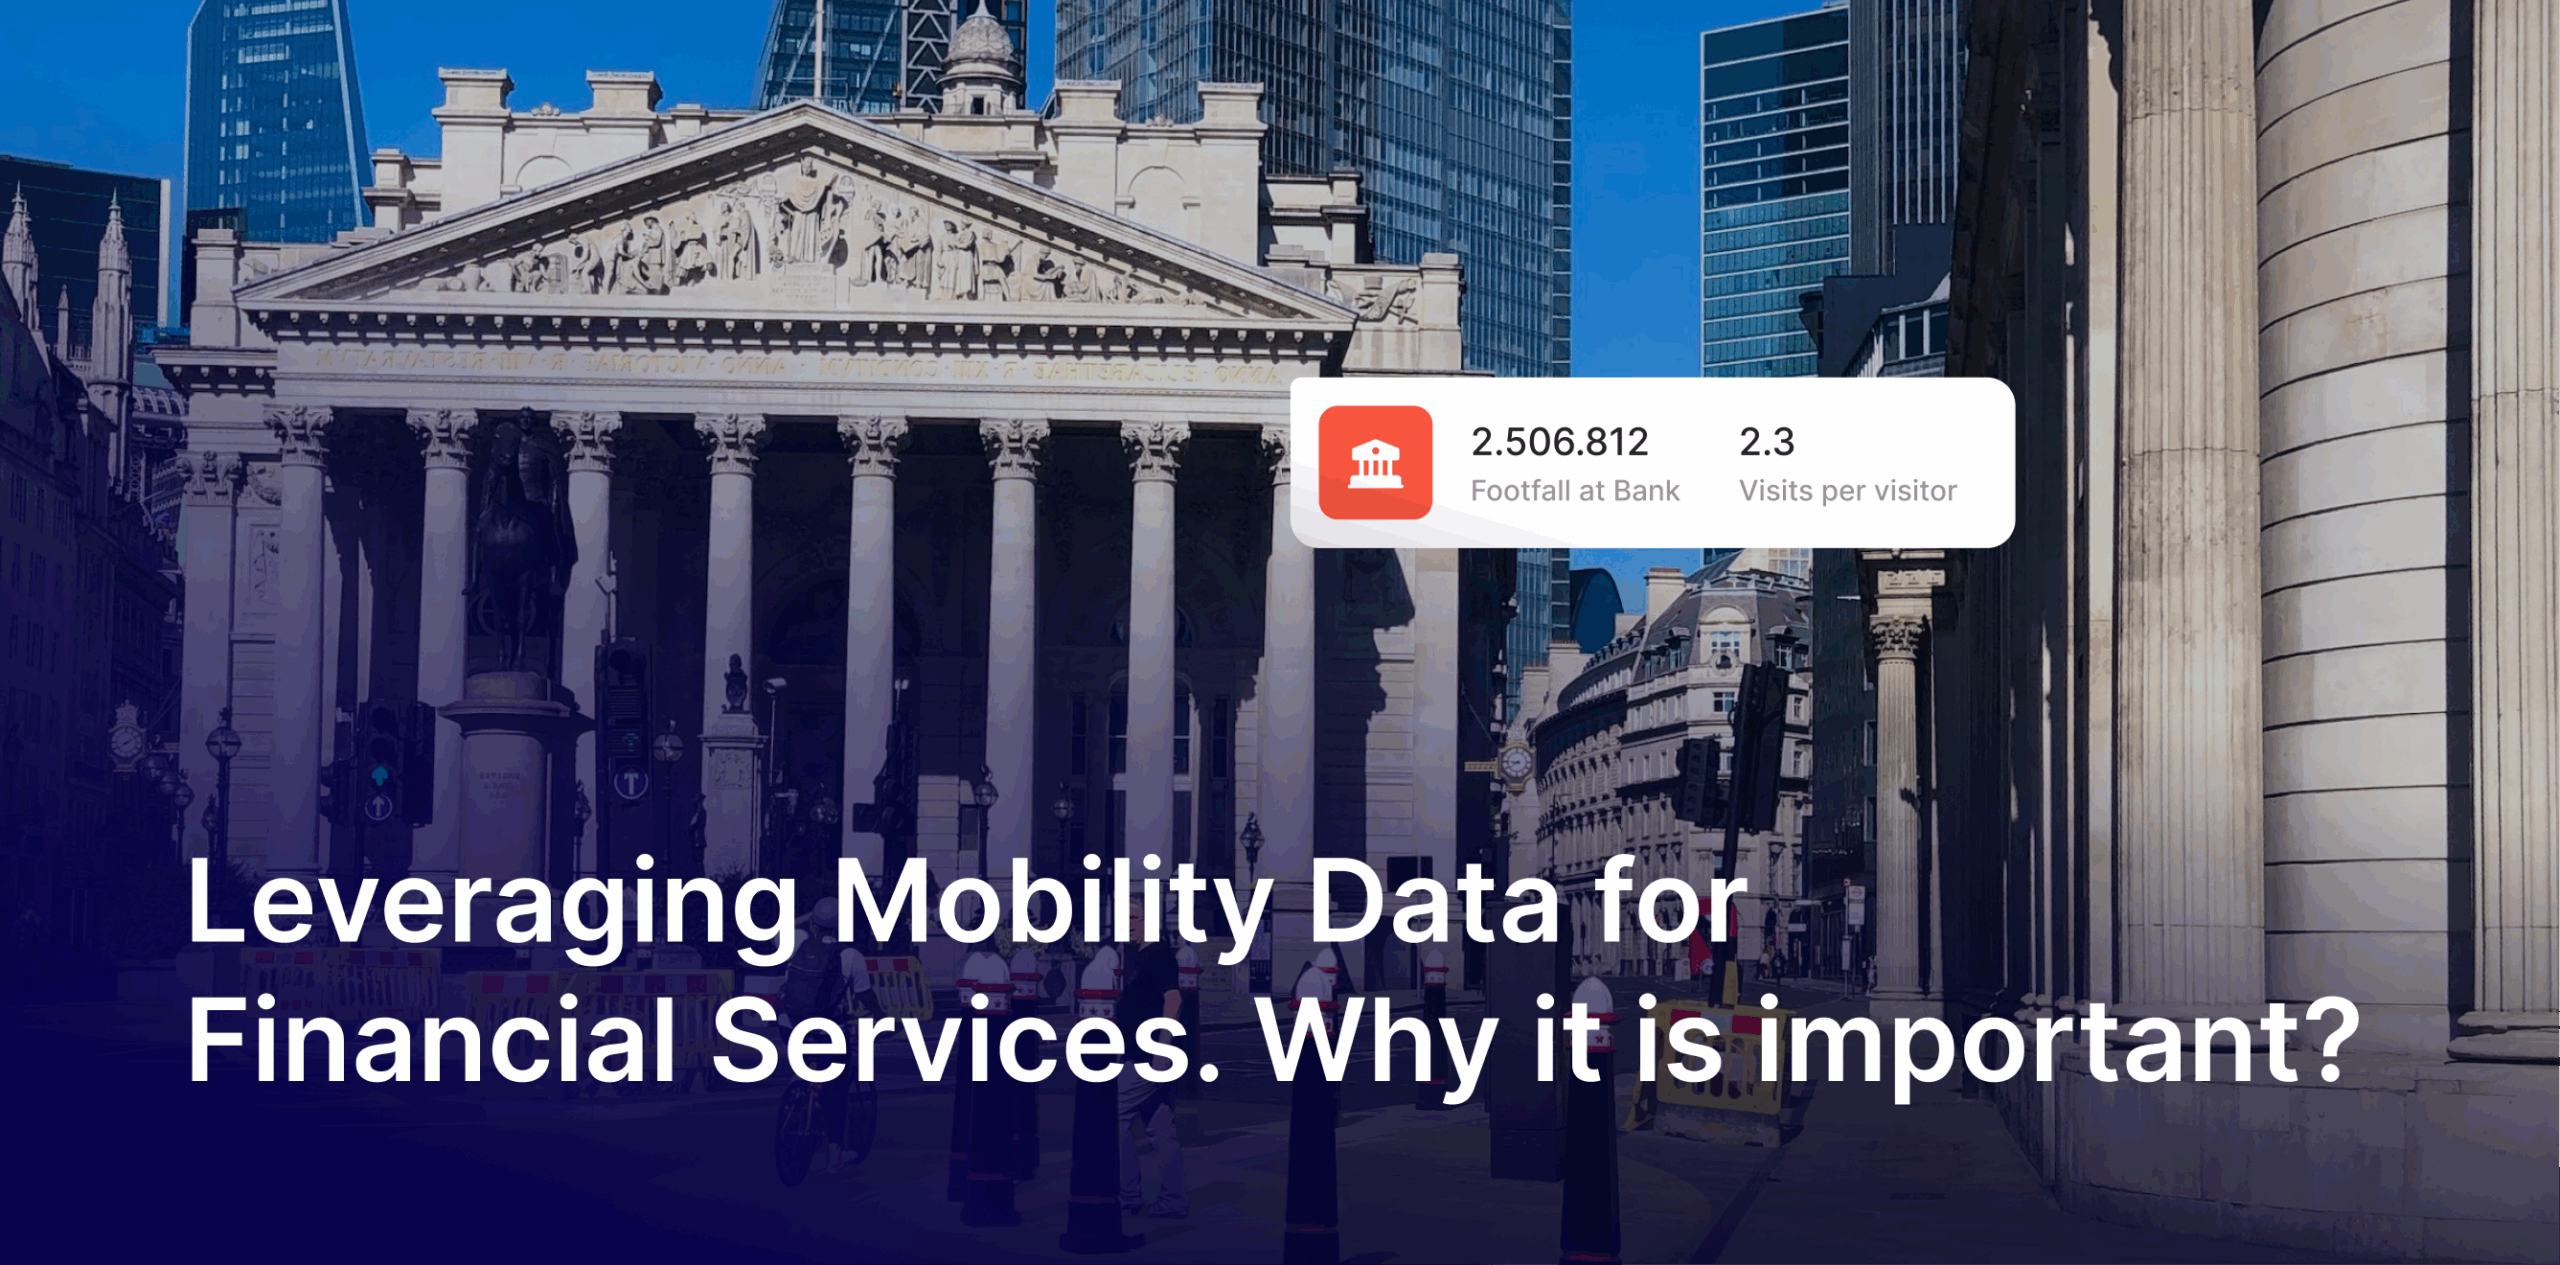
Aggregated mobility data can show changes in visits to stores, shopping districts, venues, or other physical locations.
An equity analyst may compare visitation trends across retail brands. A private equity team may use similar data to compare performance across a portfolio of physical locations.
Places and Business Data
POI and business data can reveal store networks, openings, closures, competitor locations, categories, and market density.
These signals are useful when assessing expansion, competitive exposure, market share potential, or changes in a company’s physical footprint.
Transaction and Spend Data
Aggregated transaction data can indicate changes in consumer spending across brands, categories, or markets.
It can support revenue estimation, sector research, demand analysis, and comparisons between companies before reported results become available.
Consumer and Audience Data
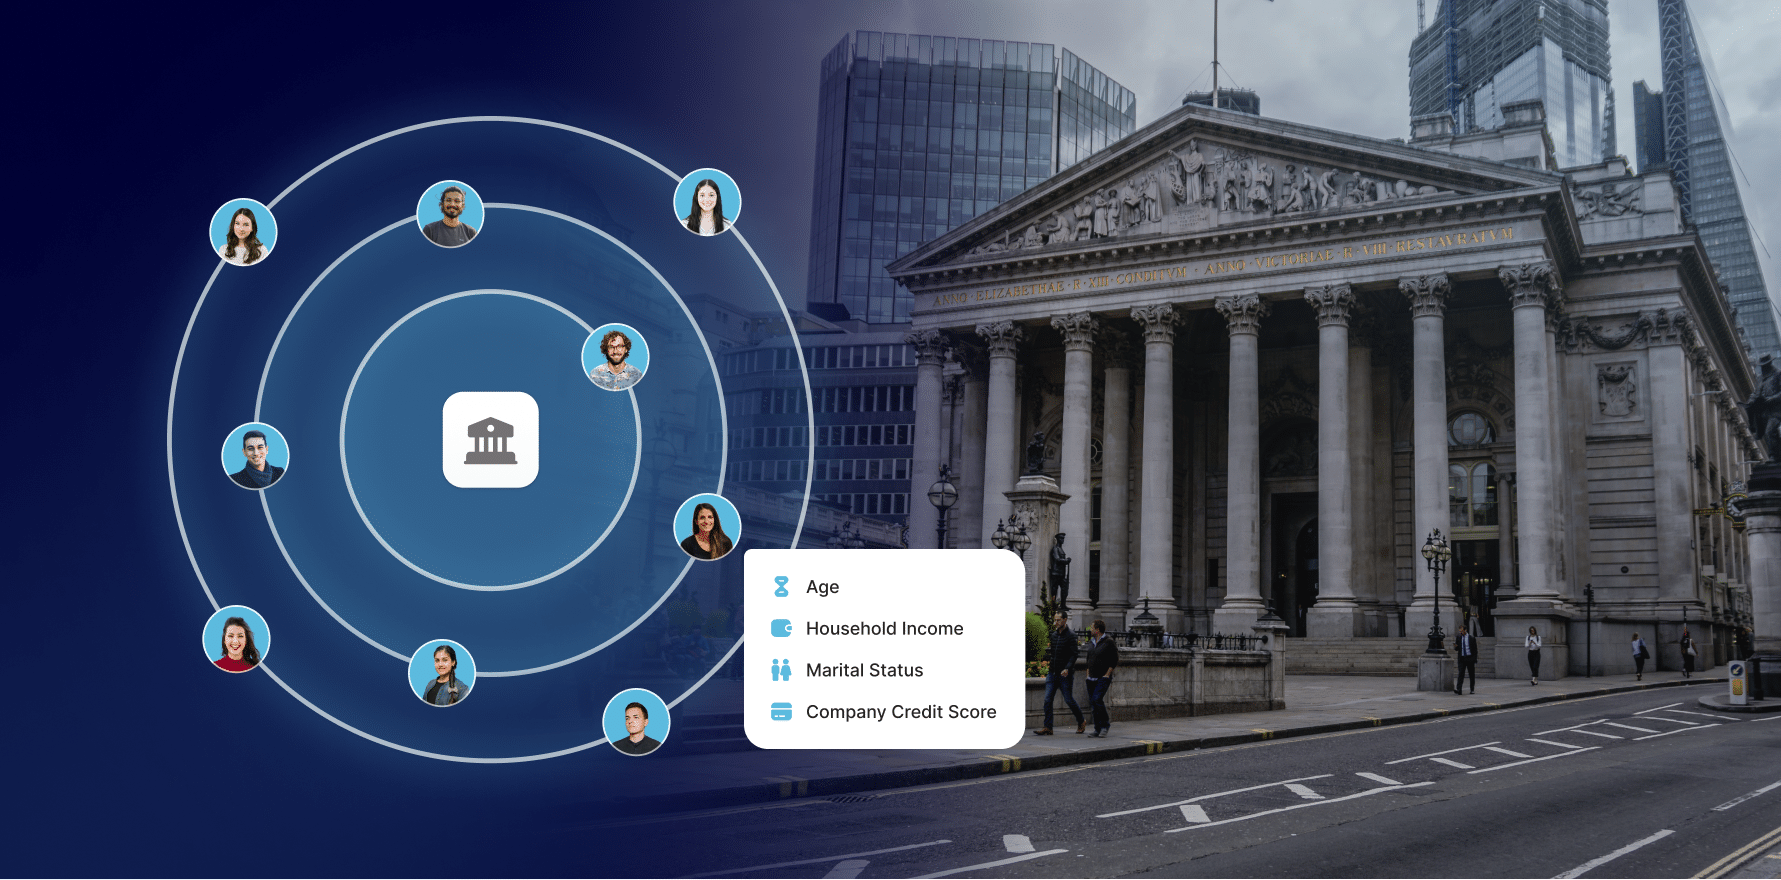
Consumer data can add demographic, household, interest, audience, or market context to financial analysis.
It can help analysts understand whether growth is concentrated among particular customer groups or whether a company’s expansion strategy aligns with the populations in its target markets.
Economic Data
Local employment, income, spending conditions, inflation, business activity, and other economic indicators can help explain differences between markets.
These variables are particularly useful when company performance depends heavily on regional demand.
Property and Real Estate Data
Property data can support analysis of ownership, physical assets, valuations, development, market exposure, and commercial real estate conditions.
This can be useful in real estate investing, lending, insurance, and private equity due diligence.
Event Data
Concerts, sporting events, conferences, holidays, and large local events can temporarily alter demand.
Event signals become particularly useful when evaluating businesses whose revenue is sensitive to local activity, travel, hospitality, or foot traffic.
Web and Digital Signals
Job postings, prices, product availability, reviews, app activity, search interest, and other digital behavior can reveal changes in demand or company activity.
These signals are most useful when there is a clear relationship between the digital metric and the financial outcome being analyzed.
How Alternative Data Is Used in Finance
Equity Research and Earnings Forecasting
Alternative data can help analysts test whether current business activity supports their earnings expectations.
A retail analyst, for example, might combine store footprint, visitation, consumer characteristics, local economic conditions, and competitor activity. The objective is not to predict earnings from one metric, but to build additional evidence around the revenue forecast.
Private Equity Due Diligence
Private equity teams often need to evaluate businesses with limited public information.
External data can provide another view of store networks, customer demand, market coverage, competition, site performance, local economics, and expansion opportunities. This can help validate or challenge assumptions made during the diligence process.
Market and Sector Monitoring
Alternative data can also be useful at the category level.
Instead of analyzing one restaurant chain, an investor may compare visitation across multiple brands. Instead of studying one hotel, a research team may track activity across an entire tourism market.
This helps separate company-specific performance from broader market movement.
Credit and Risk Analysis
External data can add environmental context to traditional risk models.
Economic conditions, business activity, property characteristics, geographic signals, and other approved data sources may help lenders or risk teams better understand the environment surrounding a business or borrower.
These workflows require particularly careful attention to privacy, fairness, licensing, and permitted use.
Financial Forecasting
Alternative signals can be added directly to forecasting models.
For example:
Historical sales + mobility + events + economic conditions
or
Company fundamentals + POI expansion + foot traffic + consumer demand
The important question is whether those additional variables reduce forecasting error on unseen periods.
Observed, Derived, and Modeled Signals Are Different
Not every alternative data field represents a directly observed fact.
A business address or store opening may come from observed records. A visitation metric may be estimated from sampled mobility data. An audience characteristic or forecast may be modeled from multiple inputs.
Financial teams should understand how every important signal was created.
At minimum, providers should be able to explain:
- the underlying data source;
- the population represented;
- the geographic and temporal coverage;
- how frequently the signal updates;
- whether it is observed, derived, estimated, or modeled;
- whether historical values can be revised.
This matters because model confidence should reflect the uncertainty in the underlying feature.
How to Evaluate Alternative Data
More data does not automatically produce better analysis.
| Evaluation area | What to validate |
|---|---|
| Signal relevance | Is there a credible relationship between the data and the financial outcome? |
| Coverage | Does it cover the companies, markets, locations, or consumers being analyzed? |
| History | Is there enough historical depth for robust testing? |
| Freshness | How quickly does the signal become available? |
| Methodology | Is it observed, inferred, estimated, or modeled? |
| Bias | Are some locations, markets, or populations systematically underrepresented? |
| Revisions | Can historical values change after initial publication? |
| Join quality | Can the data be reliably linked to companies, locations, geographies, or assets? |
| Licensing | Can the data be used for research, models, commercial outputs, or redistribution? |
| Privacy | Is the signal aggregated, privacy-safe, and appropriate for the intended use? |
A sample or pilot should answer these questions before the data becomes part of a production workflow.
Avoiding Data Leakage in Backtests
Alternative data can look highly predictive when the backtest accidentally uses information that was not actually available at the decision date.
For each feature, teams should distinguish between:
- when the real-world event happened;
- when the provider observed it;
- when the dataset was processed;
- when the customer could first access it.
Models should use the availability timestamp, not simply the event timestamp.
For example, if a store closure happened on March 1 but did not appear in the dataset until March 10, a model tested as of March 5 should not have access to that information.
This is one of the most important controls in alternative-data forecasting.
How Factori Supports Alternative Data Workflows
Factori provides real-world datasets that can be used as external inputs for financial research, forecasting, due diligence, and market analysis.
Relevant data layers include Mobility, Places, People, Audience, Business, Economic, Events, Property, Identity, and Spend Data.
The value comes from connecting these signals around companies, locations, consumers, and markets.
For example, an analyst evaluating a retailer could combine:
Store footprint + visitation + audience characteristics + economic conditions + event activity
to test whether real-world activity supports an expected revenue trend.
Factori data can be delivered through APIs, cloud environments, the Factori Platform, and MCP-based workflows, allowing teams to incorporate external signals into existing SQL, BI, data science, and AI environments.
For forecasting applications, the final test should be measurable. Compare the baseline model with the external-data model using a leakage-safe holdout period and track changes in metrics such as MAPE or MAE.
When Alternative Data Is Worth Using
Alternative data is most valuable when it adds information that traditional sources cannot provide at the required speed, geographic detail, or behavioral depth.
It may add little value when the signal has a weak relationship with the target, historical coverage is too short, sampling changes over time, or the feature fails to improve out-of-sample performance.
The goal is not to maximize the number of alternative datasets. It is to find a small number of signals that consistently improve the financial decision.
Conclusion
Alternative data gives finance teams another way to understand what is happening between traditional reporting periods.
Mobility, POI, consumer, transaction, economic, property, event, and digital signals can support equity research, forecasting, risk analysis, market monitoring, and private equity due diligence.
But the advantage does not come simply from having more data. It comes from selecting relevant signals, understanding how they were created, joining them without leakage, and measuring whether they improve the final model or decision.
For financial teams evaluating alternative data, the strongest starting point is a clear hypothesis, a representative sample, and an out-of-sample test.
FAQs
What is alternative data in finance?
Alternative data is external information from nontraditional sources that can complement financial statements, market data, filings, and economic releases. Examples include mobility, POI, consumer, transaction, web, economic, property, and event data.
Who uses alternative data?
Alternative data is used by hedge funds, asset managers, banks, lenders, private equity firms, research teams, and other financial organizations.
How is alternative data used for investment research?
Analysts use it to monitor demand, compare companies, track physical activity, estimate market changes, evaluate expansion, and test whether real-world signals support financial forecasts.
Can alternative data improve financial forecasting?
It can, but only when the signal has predictive value and is tested correctly. Teams should compare models on unseen periods and measure whether the additional feature reduces forecasting error.
What should firms check before buying alternative data?
They should evaluate coverage, history, freshness, methodology, bias, join quality, revisions, licensing, privacy, and whether the dataset improves the intended analytical or forecasting workflow.