Trusted by

Trusted by
Most plans assume the world is stable: demand follows history, roads behave, and markets grow evenly. In reality:
Factori gives you a clear, outside‑in view of every route, depot, and service area so you can:
Decide where to open, resize, or close nodes based on real demand, access, and growth.
Align routes with actual congestion, incident patterns, and movement corridors.

Plan labor, fleet, and linehaul capacity using local demand and economic signals—not just last year’s volume.

Protect ETAs and SLAs by understanding which areas are structurally high‑risk and which are not.

See where you can pool, hold closer to demand, or consolidate without surprising service impacts.

You keep your WMS, TMS, and planning tools. Factori adds the real‑world layer they’re missing.
You choose the mix. We make the data simple, consistent, and aligned to your locations and zones.

Combine Retail Sales, Economic, People, and Places to identify where capacity should sit over the next few years.
Use Traffic, Mobility, and Events to set realistic transit assumptions and build more robust plans.
Pair volume forecasts with local demand and events so inbound/outbound staffing matches reality.
Flag high‑risk zones and time windows so you can add buffers, change promises, or adjust routing.
Use Real‑world data to decide how much capacity each channel (store, e‑com, marketplace, B2B) needs by region.
Which lanes and service areas are structurally high‑risk for delays?
Where should we add or remove capacity for next season?
How will events or local economic changes affect volume in specific regions?
Are our depots and hubs in the right places for where demand is going, not just where it has been?
How can we adjust ETAs and promises by area to reduce missed deliveries and penalties?
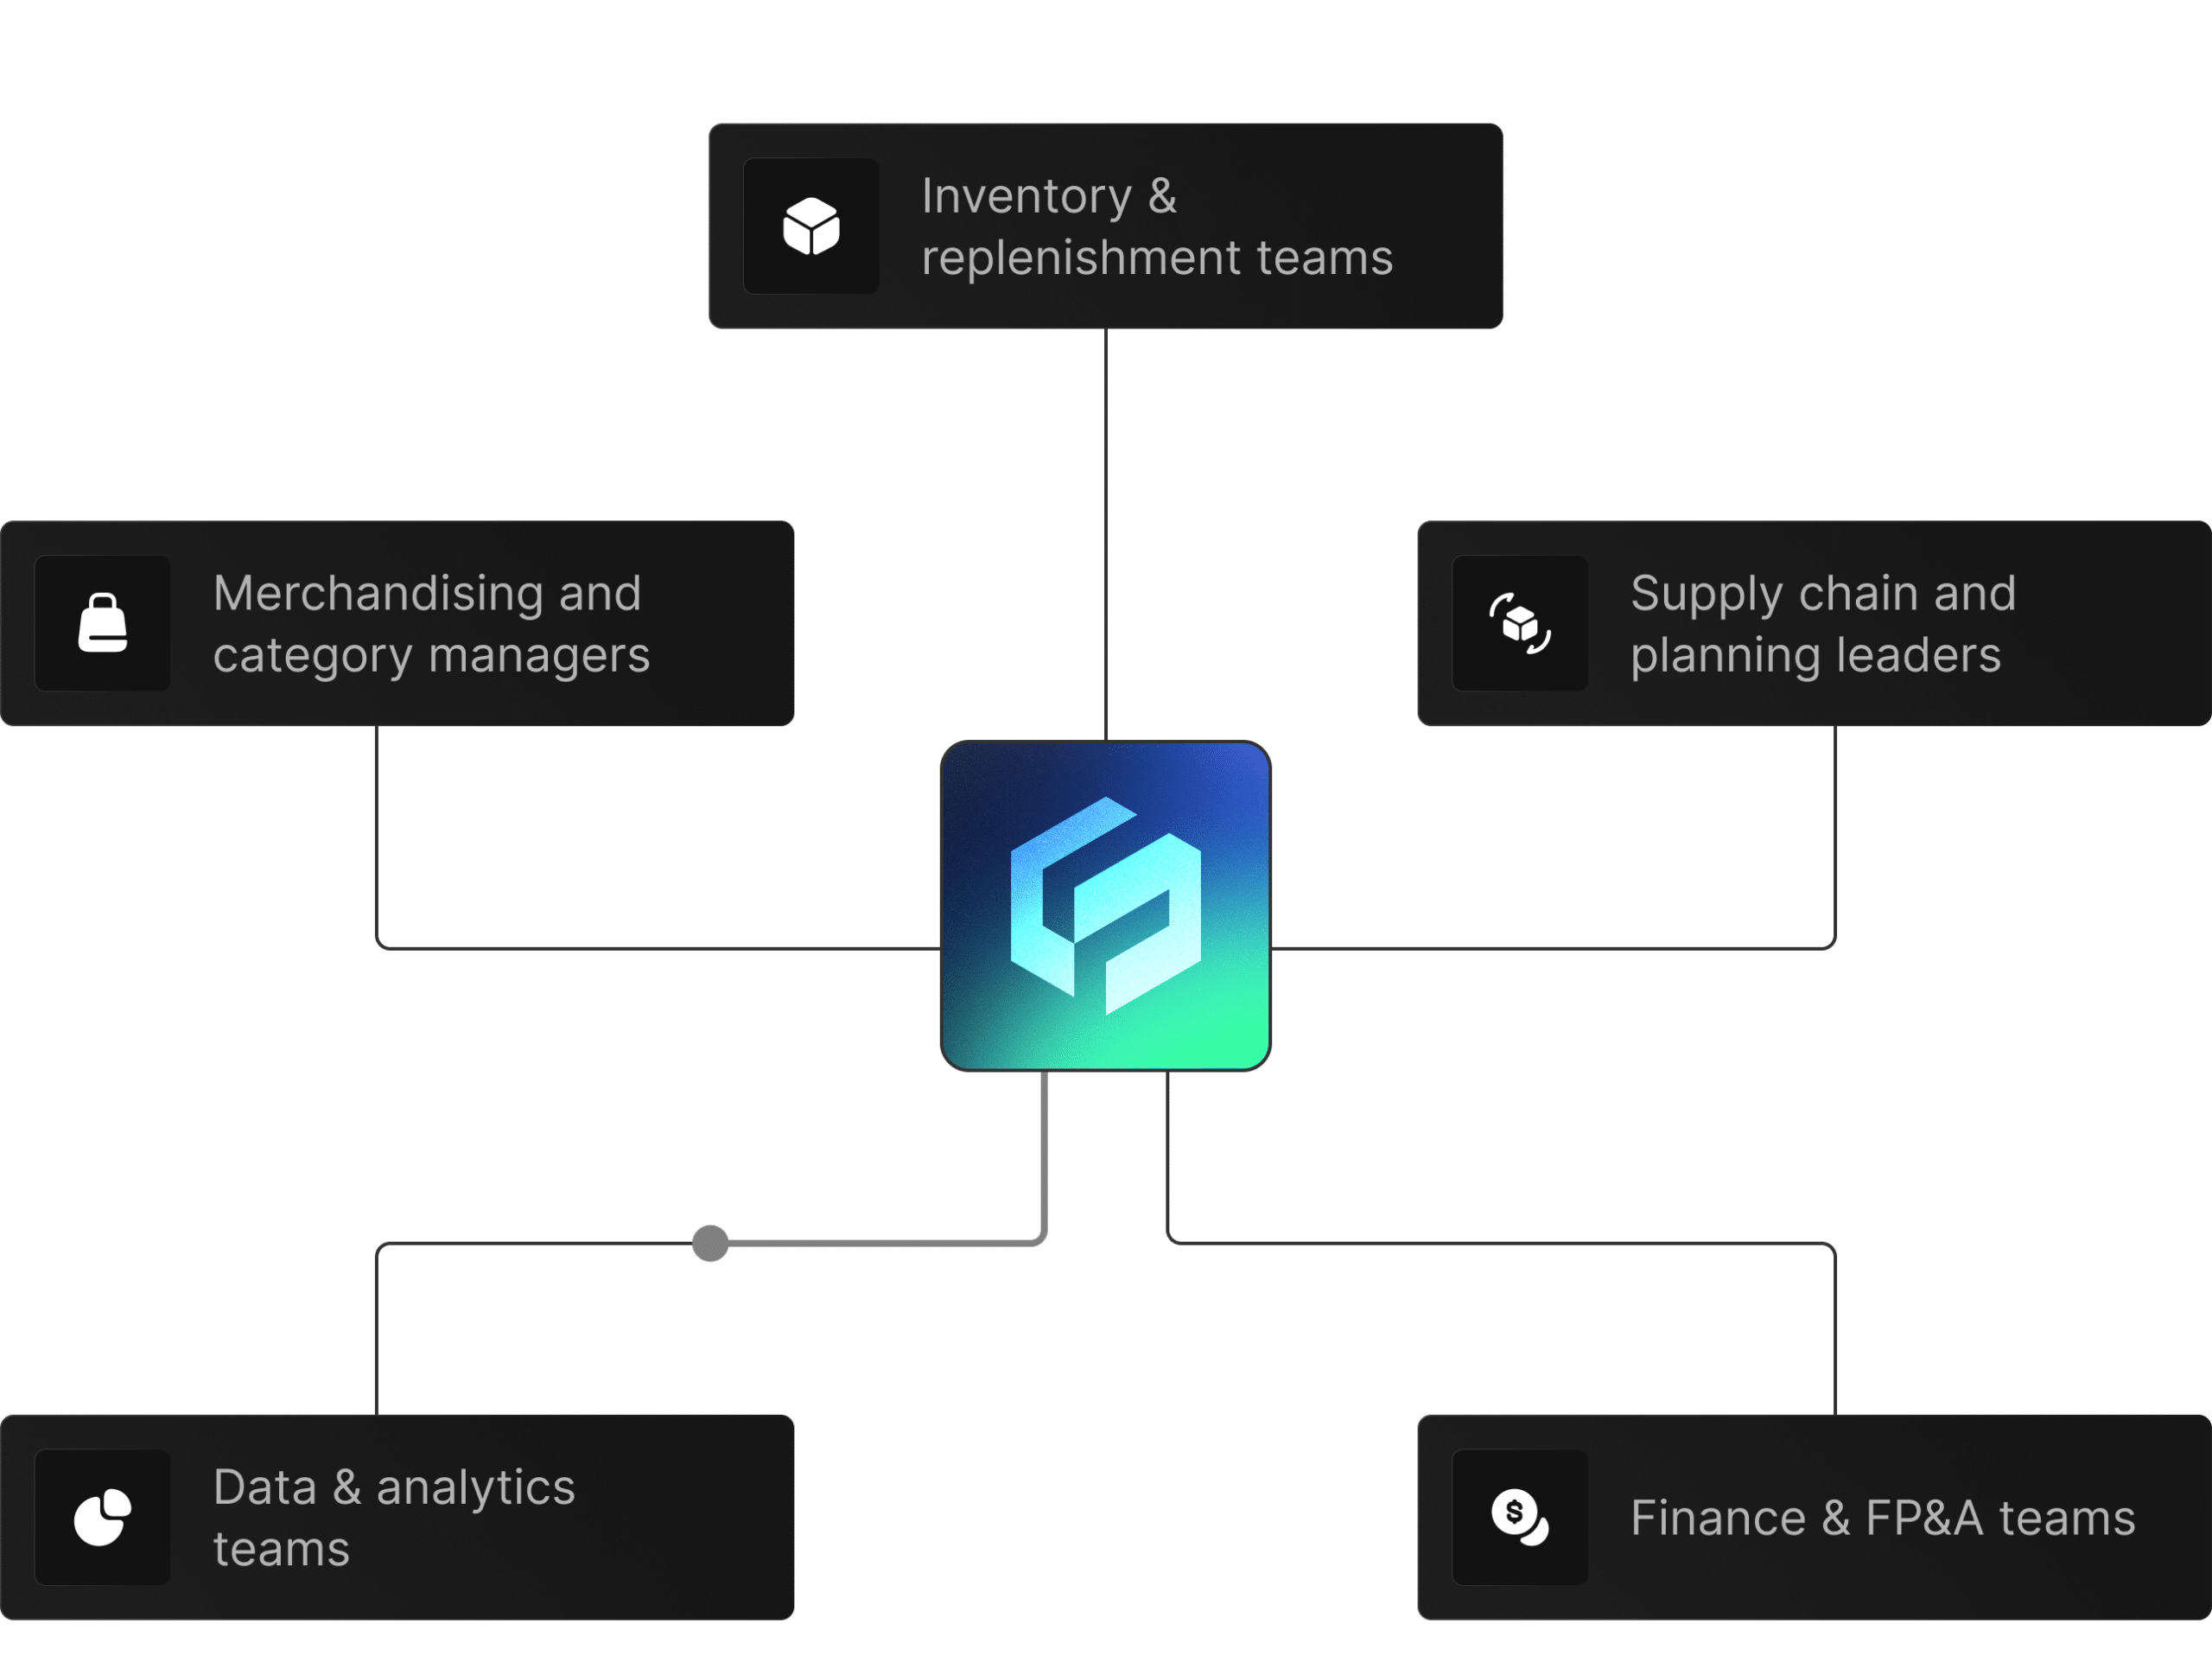
 Supply chain and logistics leaders
 Network design and optimization teams
 Transportation and linehaul planners
 Last‑mile and delivery operations
 Inventory and S&OP teams
 Data & analytics teams supporting planning and performance
Choose a region, network segment, or lane group where performance or cost is a concern.
For example: Traffic + Events + Mobility for last‑mile, or Retail Sales + Economic + People for network and capacity planning.
Compare current plans with “plans informed by Factori data,” and identify specific route changes, node decisions, or capacity moves.
© 2026 Factori. All rights reserved.