Trusted by

Trusted by
Combine mobility, events, people, and competition to find drive‑thru and walk‑up locations that match your format.
Use retail sales, people, economic, and property data to find trade areas that can support your store model and basket targets.

Evaluate corridor traffic, nearby formats, and local demand before investing in new sites or rebuilds.

Prioritize banners and markets by business mix, retail spend, and neighborhood fit.

Build stronger leasing stories with objective data on demand, tenants, and neighborhood trajectory.

Is this location in a high‑traffic, high‑fit area or just a busy corner?
Who actually lives, works, and shops in the trade area?
Are we cannibalizing an existing site or tapping into new demand?
Is the market growing, stable, or softening?
Are we surrounded by the right mix of businesses, anchors, and formats?
You don’t need another abstract score. You need simple, concrete signals you can put in front of your committee.
You choose the mix; we make them easy to line up side‑by‑side for every option.

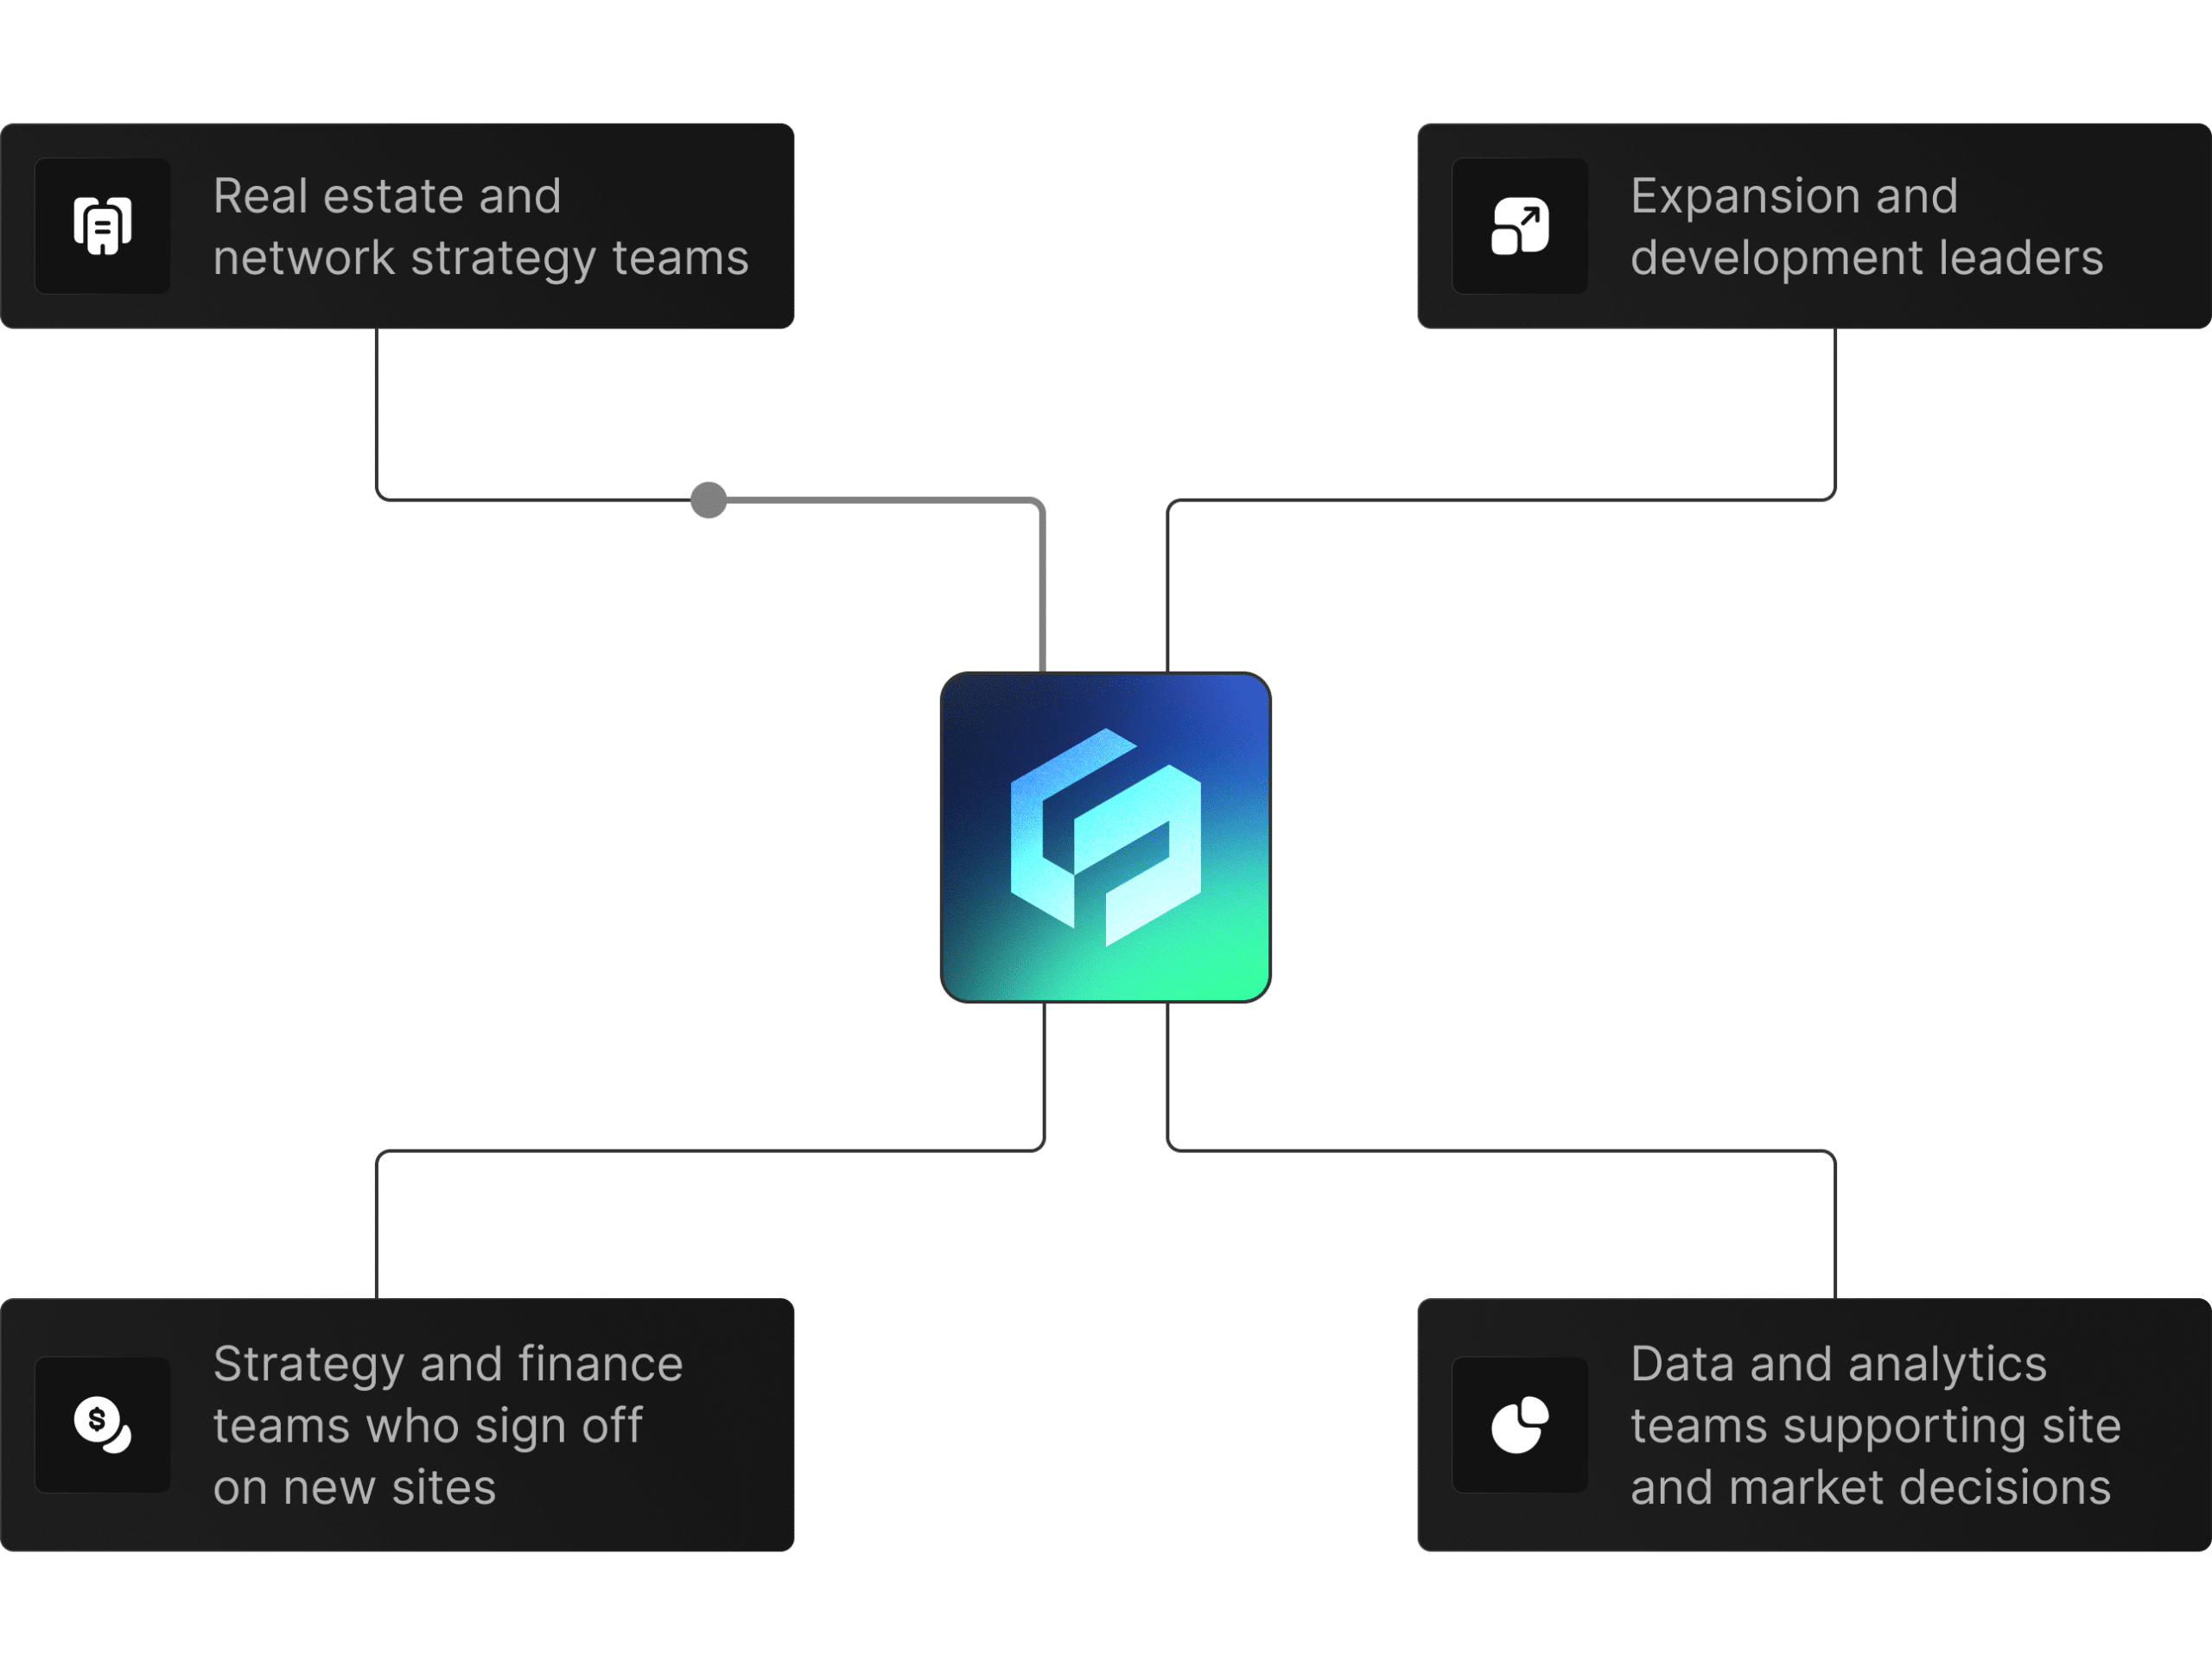
 Real estate and network strategy teams
 Expansion and development leaders
 Strategy and finance teams who sign off on new sites
 Data and analytics teams supporting site and market decisions
A mix of recent opens, stable performers, and candidates you’re considering.
Mobility, Places, Business, People, Economic, and anything else that’s relevant for your format.
See which patterns show up repeatedly—and which sites don’t look so strong under the same lens.
Align on a short list of signals that must be checked for every new site decision going forward.
© 2026 Factori. All rights reserved.