Everything happens somewhere

Factori’s Real‑World Graph Model is the data model that connects every place, person‑segment, trip, event, business, and signal into one consistent view of the physical world—so your team doesn’t have to juggle 10 different datasets and join keys every time you ask a question.

Trusted by

Trusted by

Say hello to real-world-graph-model-1

Think of it as a smart map for business decisions.

Instead of treating mobility, places, people, events, sales, and economics as separate files, the Real‑World Graph Model describes how they all relate:

A store or branch sits on a specific property

People live and work in nearby neighborhoods

Events happen at venues and affect nearby roads and locations

Traffic and access shape how easy it is to get there

Local economics and spend patterns shape demand

The result

When you look at any store, depot, branch, clinic, or corridor, you see the full real‑world context in one place.

The four layers of the Real‑World Graph

We organize the physical world into four simple layers. Every Factori dataset plugs into one or more of these.

Places & Property — where things are

The backbone of the model.

Datasets used

Places

Business

Property

Activity & Movement — what happens where and when

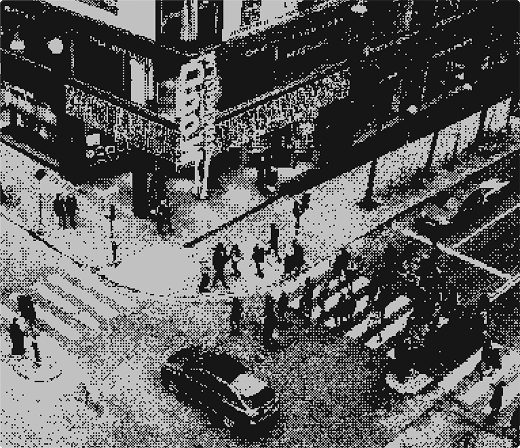
How people and activity flow through space and time.

Datasets used

Mobility

Events

People & Market Context — who’s around and how healthy the area is

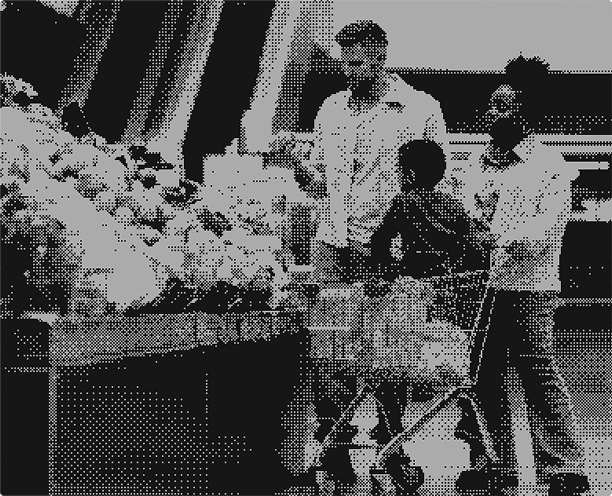
The people and economics behind each area.

Datasets used

People

Economic

Market

Retail & Business Outcomes — how markets perform

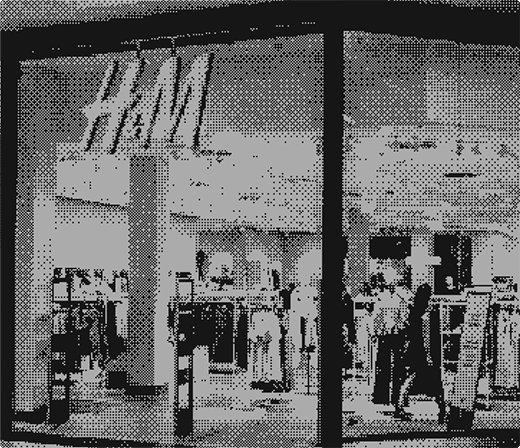
The demand and business side.

Datasets used

Retail

Business (plus your own performance data when you choose to bring it)

How our datasets come together in the graph

Each Factori product is one part of the same model:

Mobility

Mobility

How people move through the physical world—visits and patterns around stores, venues, and neighborhoods.

Places

Places

Clean, consistent details about stores, restaurants, venues, points of interest, and their surroundings.

People

People

Privacy‑safe consumer graph covering demographics, income bands, lifestyle and interest indicators.

Events

Events

Local events that move demand: concerts, sports, conferences, school calendars, public holidays, and more.

Retail Sales

Retail

Retail sales indicators by market and category to show where spend is rising or softening.

Business

Business

Business density and composition by area: categories, formats, and competitive mix around your locations.

Property

Property

Context on parcels and neighborhoods: land use, property types, and housing stress indicators.

Market

Market

Search and commerce signals: which brands, products, and categories are gaining attention across markets.

Economic

Economic

Local economic pulse of income, employment, and other fundamentals that shape background demand.

What this unlocks for you

The Real‑World Graph Model makes complex questions simple to answer, for example:

Demand Forecasting

For each store, branch, or depot: what should we expect next week, given mobility, events, traffic, and local economics?

Which candidate sites truly look like our best performers once we factor in audience, movement, competition, and economics?

Where will demand shift if interest, spend, or movement patterns change in these corridors?

Which neighborhoods and corridors are the best fit for this campaign based on who’s there, where they move, and how they spend?

Which locations need staffing changes next weekend because of events, traffic, or demand shifts?

Where can we safely adjust prices or offers because demand and local conditions support it?

Give our models and copilots one consistent ‘real‑world layer’ so they can answer location‑aware questions out of the box.

Why teams use our data for targeting

How it fits into your stack

You bring your locations, routes, depots, branches, and performance data.

Factori provides datasets that already align to a shared Real‑World Graph Model.

Your data and models sit on top, using the graph as a reliable context layer across teams and tools.

No need to become graph experts—the model is the backbone we use so your teams can work with simple, familiar tables and concepts.

See the graph on your world

Start with a region, network, or set of locations you know well.

Connect a few datasets

For example: Places + Mobility + People + Economic around your stores, branches, or depots.

Ask real questions

Use the Real‑World Graph Model to answer concrete planning and forecasting questions, and decide where to scale from there.