Trusted by

Trusted by
QSR is won and lost on small margins and short windows: the lunch rush, the game night, the storm, the new competitor across the street.
Most teams are still planning off:
Factori adds the outside‑in view, so you can:
Make short‑term forecasts that account for local traffic, events, and market shifts.

Align crew levels with real visit patterns, not just averages or “what we did last year.”

Decide where to open, relocate, or add new formats (drive‑thru only, smaller footprint, etc.).

Staff and plan for the mix of dine‑in, drive‑thru, and delivery in each trade area.

Focus spend and offers on neighborhoods where demand and fit are strongest.

You bring POS, loyalty, and ops data. Factori brings the real‑world layer.


Which restaurants should get extra crew on game nights or concert days?
Where should we test our next format or concept first?
Where is category interest rising but we don’t yet have strong presence?
Which locations are underperforming given their footfall, competition, and local audience?
How should staffing and promo plans change in neighborhoods where economics are softening?
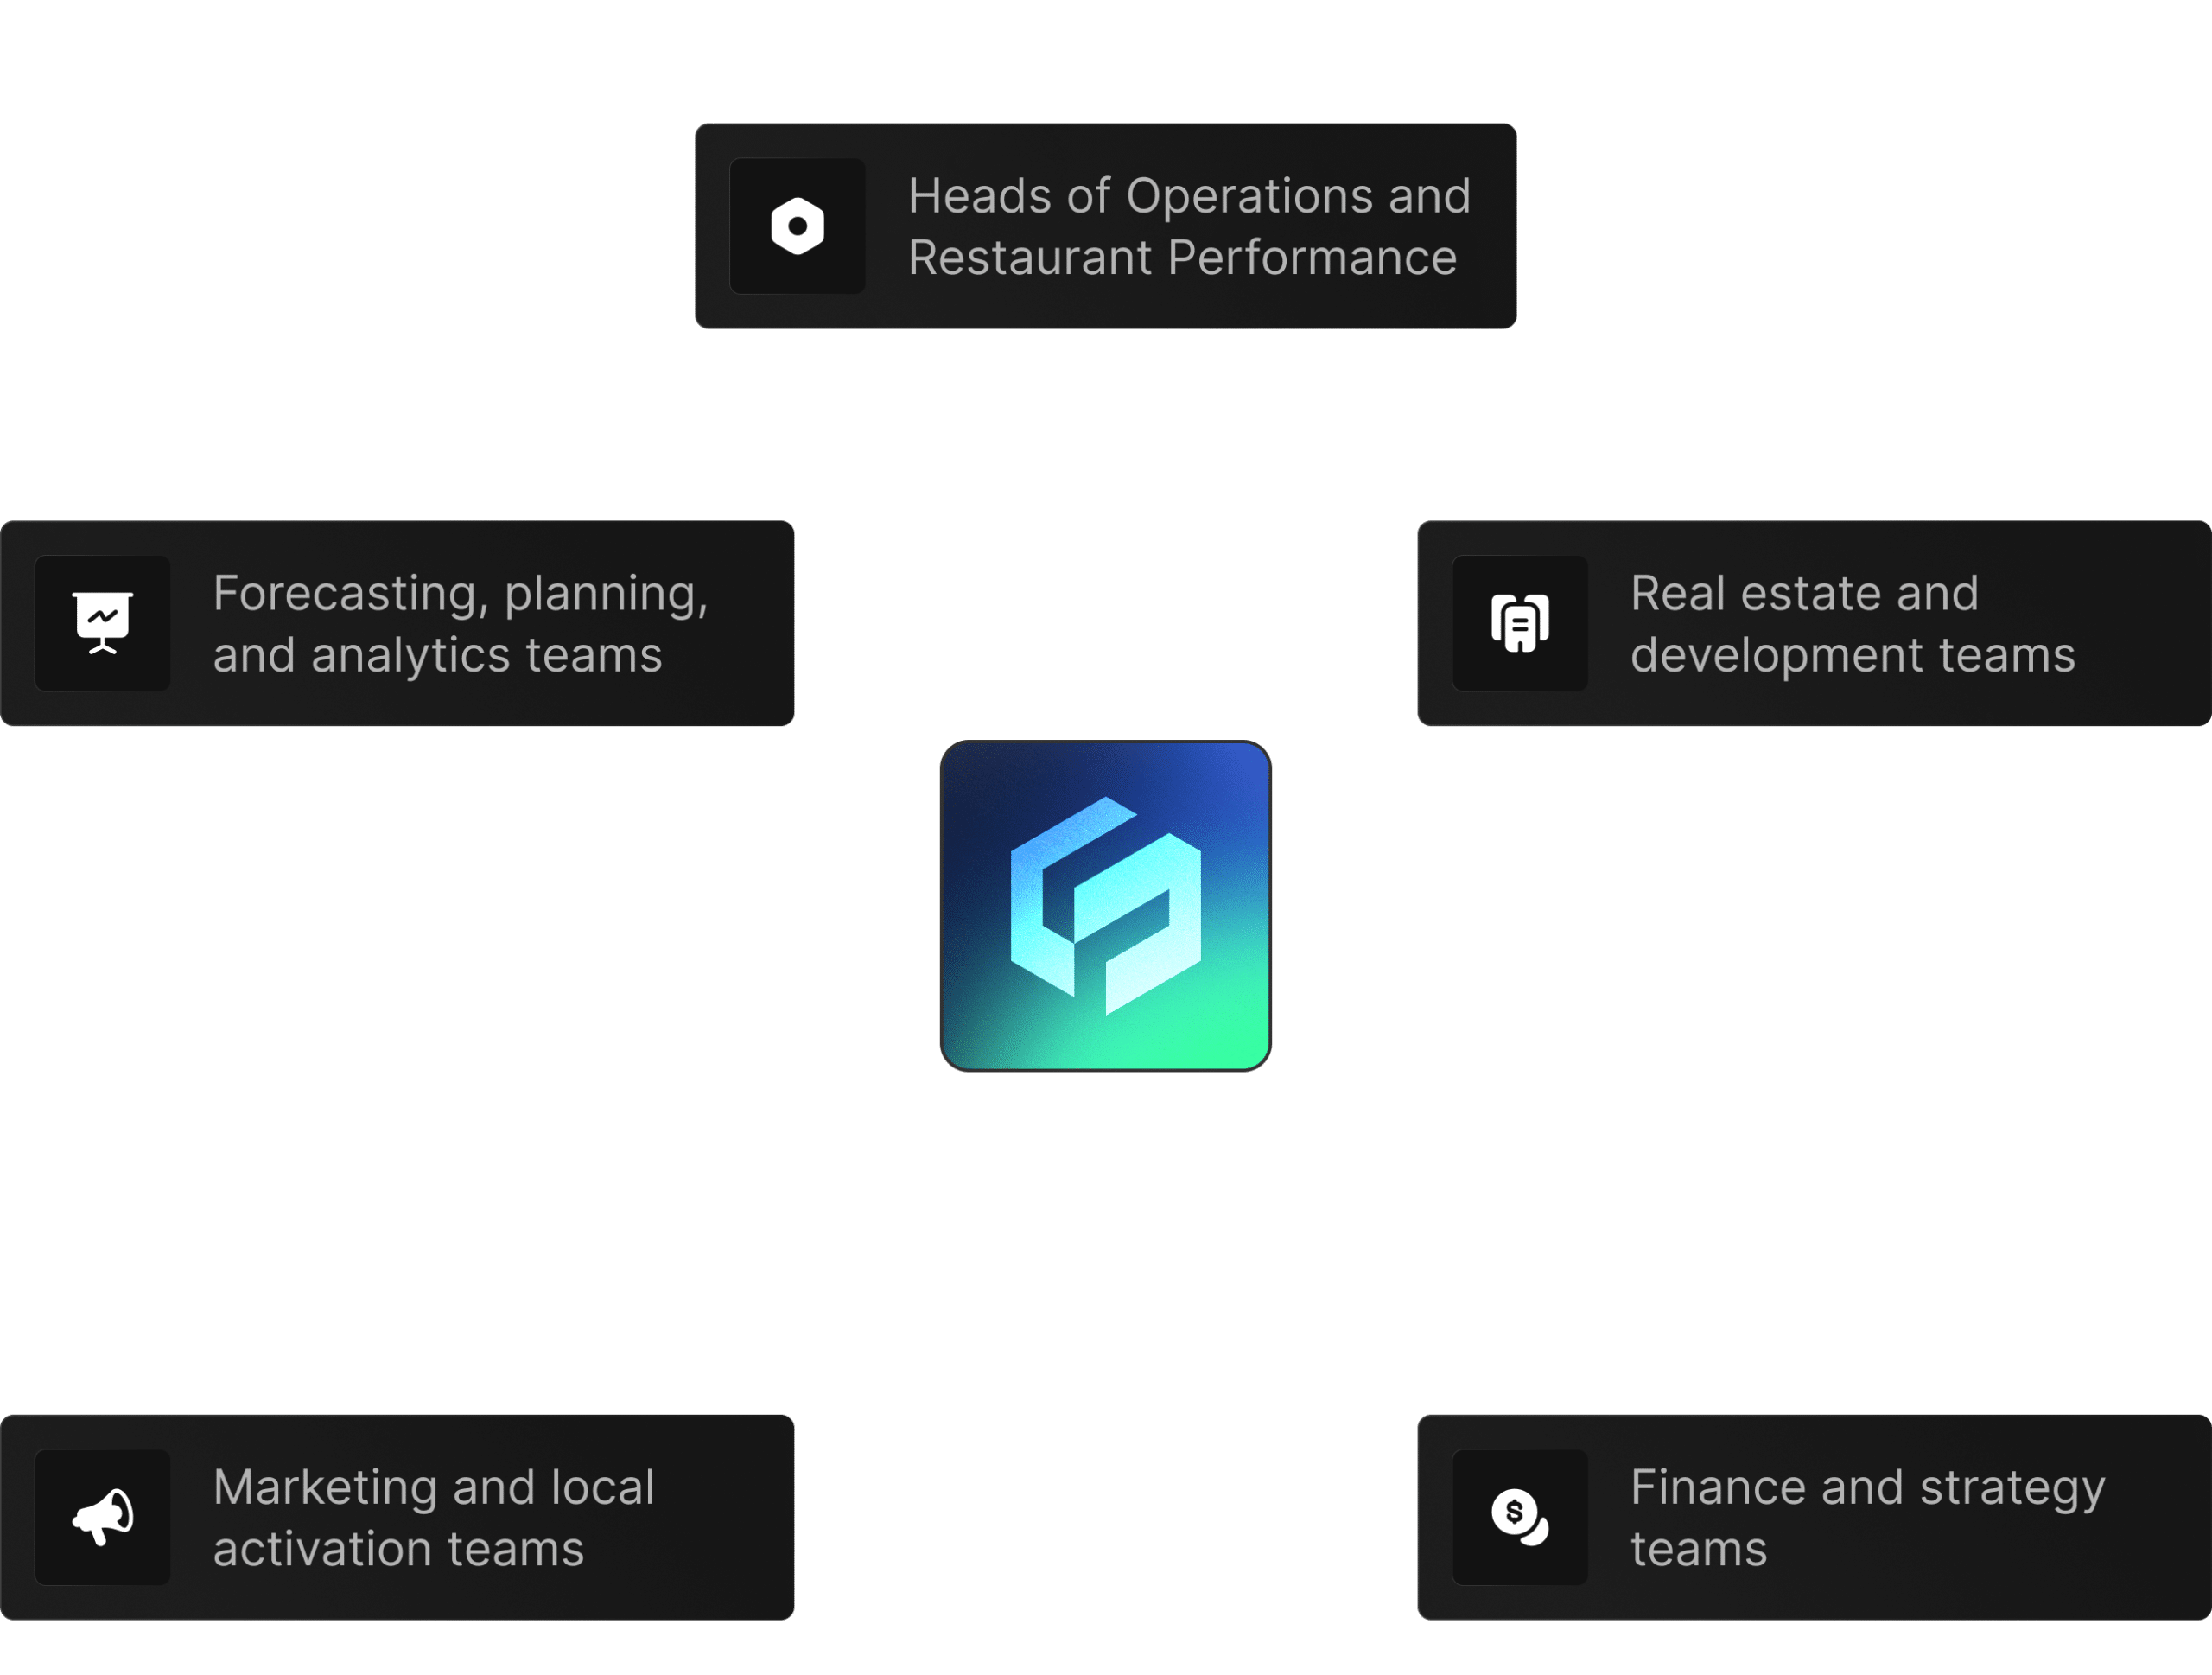
 Heads of Operations and Restaurant Performance
who need error down and trust up.
 Forecasting, planning, and analytics teams
Looking for clean, reliable visit data to plug into models and dashboards.
 Real estate and development teams
Looking for clean, reliable visit data to plug into models and dashboards.
 Marketing and local activation teams
Looking for clean, reliable visit data to plug into models and dashboards.
 Finance and strategy teams who sign off on expansion and budgets
Looking for clean, reliable visit data to plug into models and dashboards.
For example: forecast & labor accuracy, new site decisions, or local marketing for a region.
Common starting point for QSR: Mobility + Events + People + Business, then layer in Market or Retail Sales as needed.
Compare “current approach” vs “current + Factori data” on a set of restaurants, and review the impact on accuracy, staffing, and decisions.
© 2026 Factori. All rights reserved.