Trusted by

Trusted by
Most public sector decisions still lean on:
That makes it hard to see:
Factori adds a simple, outside‑in layer to your existing data, so you can:
Understand who lives, works, and moves through each area before changing zoning, services, or amenities.

Decide where to place clinics, community centers, hubs, and offices based on need and access.

Align projects with real movement, traffic patterns, and demand, not just theory.

See how economic stress, traffic, and events shape where support or enforcement is most needed.

Plan around concerts, sports, festivals, and civic events with better crowd and traffic context.

Target investment and support to neighborhoods and corridors where the conditions for growth are strongest.

You bring administrative, program, and operational data. Factori brings the real‑world layer.
All datasets are aggregated and designed to be simple to understand, share, and join to your geographies and assets.


Which corridors truly carry the most people, and when?
Where are services hardest to reach for lower‑income or aging populations?
Which main streets are quietly strengthening vs. at risk of decline?
How will a new stadium, campus, or district affect nearby neighborhoods and traffic?
Where should we focus limited resources for safety, resilience, or economic support?
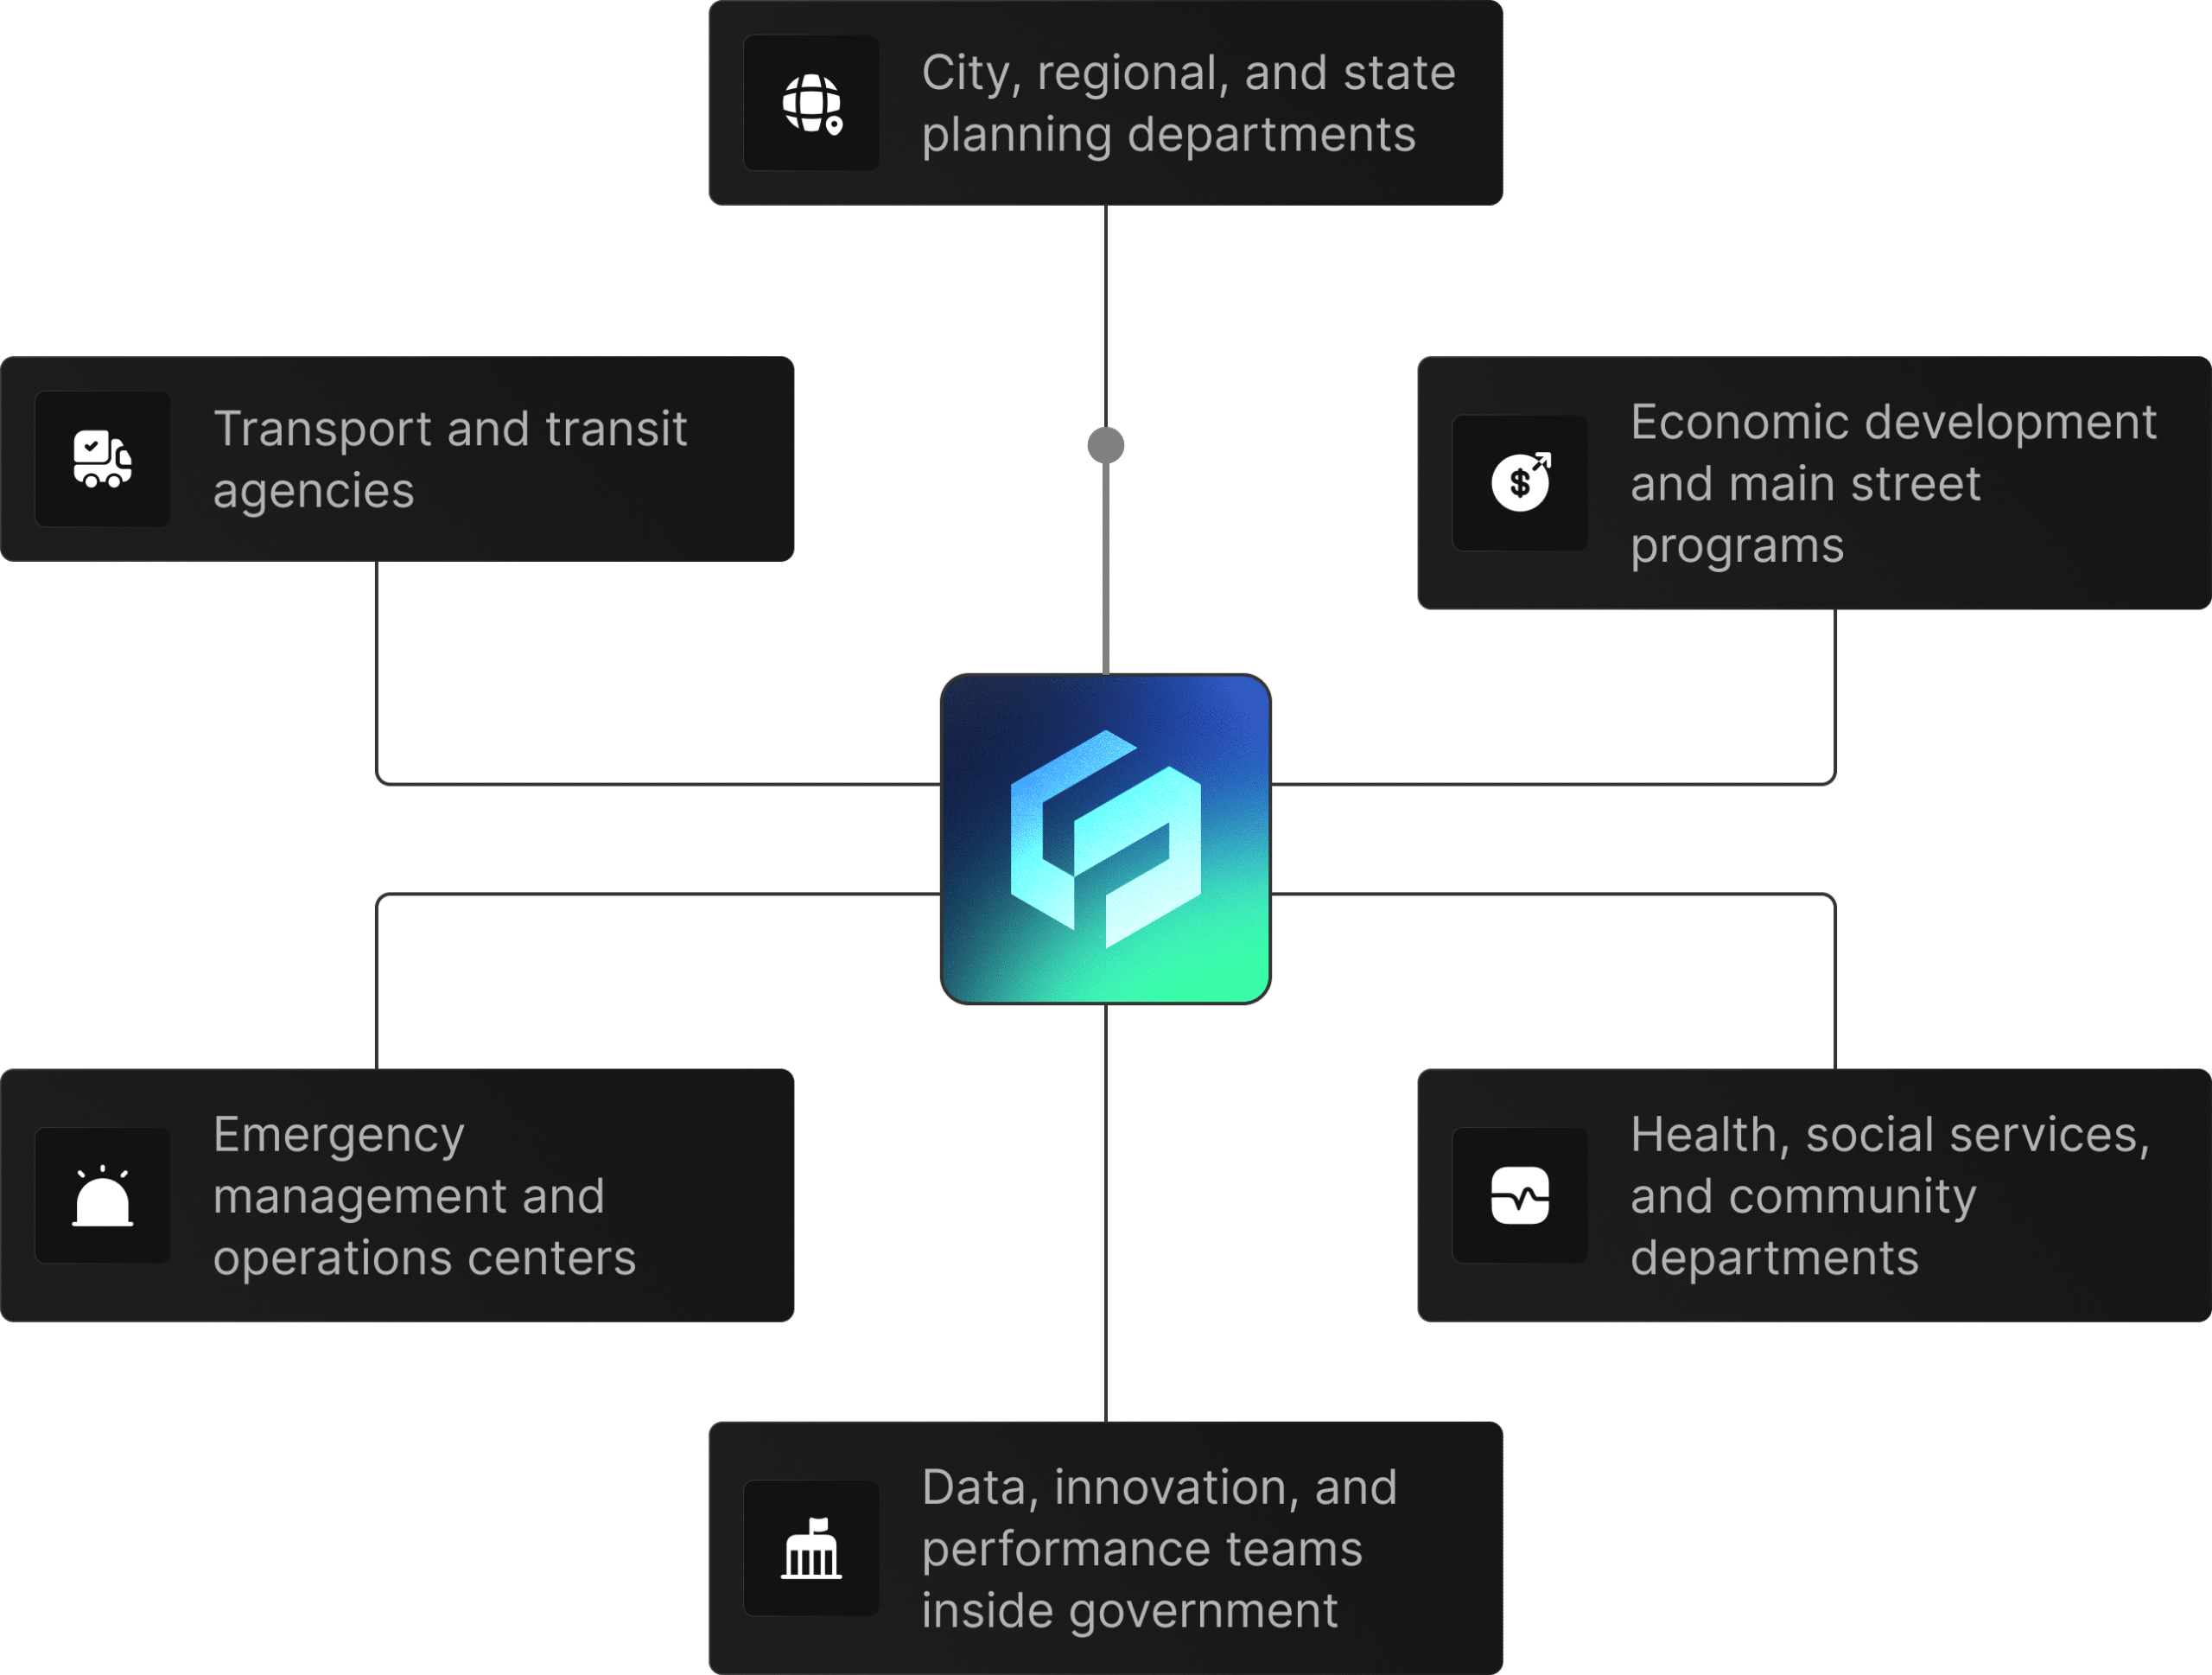
 City, regional, and state planning departments
 Transport and transit agencies
 Economic development and main street programs
 Emergency management and operations centers
 Health, social services, and community departments
 Data, innovation, and performance teams inside government
For example: a planned corridor project, an upcoming season of events, or a service placement question.
Common starting point for public sector: Mobility + People + Economic + Places + Traffic, then add Events, Business, Retail Sales, or Property as needed.
Compare how you plan today vs. how decisions look with real‑world data, and decide where to adjust plans, investments, or operations first.
© 2026 Factori. All rights reserved.