Trusted by

Trusted by
The mix of residential, retail, office, industrial, and mixed‑use around your locations.

Area‑level view of owners vs renters, and how “dense” or spread out housing is.

Whether an area is mostly single‑family homes, low‑rise apartments, high‑rises, or commercial strips.
Simple indicators of housing stress, vacancies, and crowding that help you understand stability and pressure.

Where development, infill, and redevelopment are happening, and where things are relatively static.
Everything is delivered in a simple, comparable way so you can line up properties, neighborhoods, and markets side by side.
Make sure your concept fits the surrounding built environment and housing mix.
When two locations behave differently, see if property and neighborhood structure is part of the story.
See where new development or stress is building before it fully shows up in your numbers.
Give real estate, operations, and finance a shared, objective view of what’s on the ground.
Pick locations and formats that match the surrounding housing and land use profile.
Assess which areas are likely to strengthen, stabilize, or struggle based on property and housing indicators.

Balance growth across urban, suburban, and emerging corridors—not just where you already have sites.

Use property context to refine expectations for visit patterns, basket size, and visit frequency.
Understand how residential vs industrial land use around depots might affect volume and service expectations.
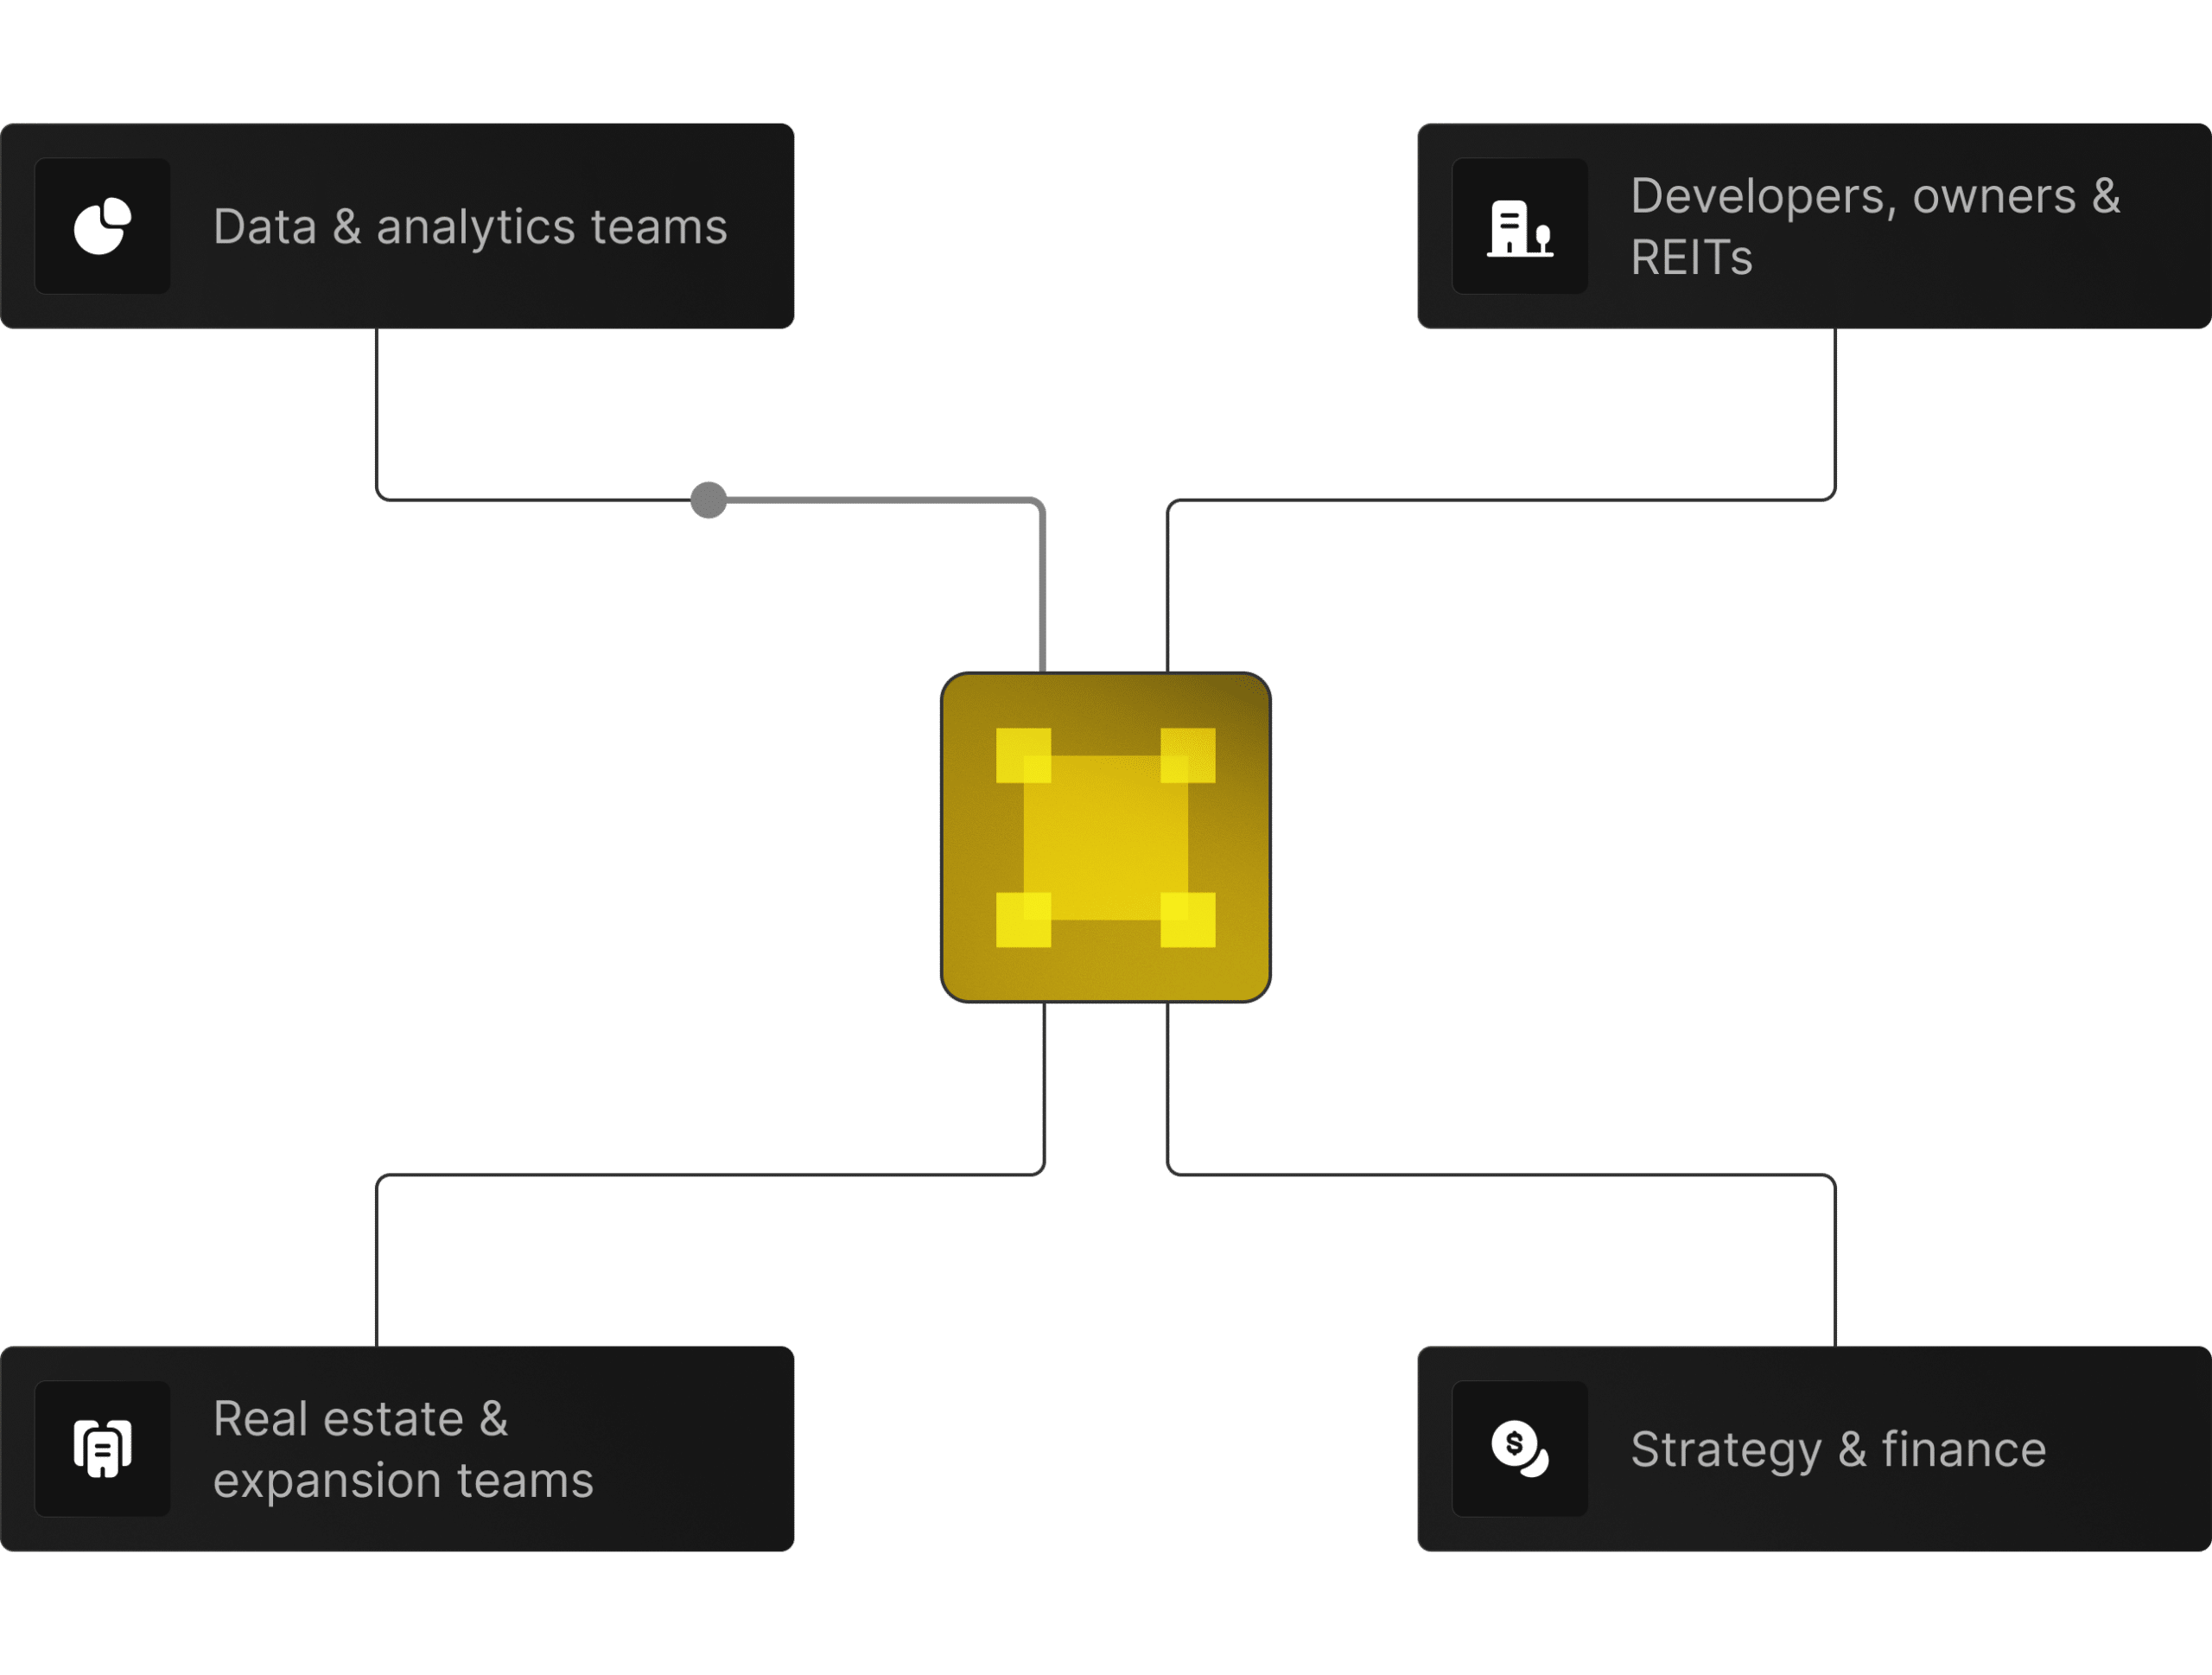
 Real estate & expansion teams
Choosing where to open, upgrade, or close locations.
 Developers, owners & REITs
 Evaluating neighborhood trajectory and asset positioning.
 Strategy & finance
 Stress‑testing growth plans and underwriting against local physical reality.
 Data & analytics teams
Adding a clean, consistent view of the built environment to models and dashboards.


Tell us which stores, branches, assets, or regions you care about.
Explore Property data for a few key areas and see how it matches what you know on the ground.
Make Property part of how you evaluate sites, review performance, and plan growth.
© 2026 Factori. All rights reserved.


