Trusted by

Trusted by
How many people visit an area, how often, and on which days and times.

Where visits are rising, falling, or shifting across your network.

Which neighborhoods & corridors your visitors are really coming from.

Weekday vs weekend, lunch vs evening, event days vs “normal” days.

Capture people who visit the area but don’t transact yet.
Match staffing, inventory, and hours to actual traffic patterns.
Spot areas with strong organic footfall and understand cannibalization risk.
When performance moves, quickly answer: “Did the traffic change, or just conversion?”
Use visit patterns to improve short‑term demand and labor forecasts.

Compare potential locations by real footfall, not just gut feel or single‑source data.
Adjust stock and assortment based on who passes by and when they come.

Focus campaigns on high‑traffic zones and measure movement before and after campaigns.

Build staffing plans that align with peak hours, days, and seasons.

Understand catchments and corridors to plan depot locations and delivery zones.

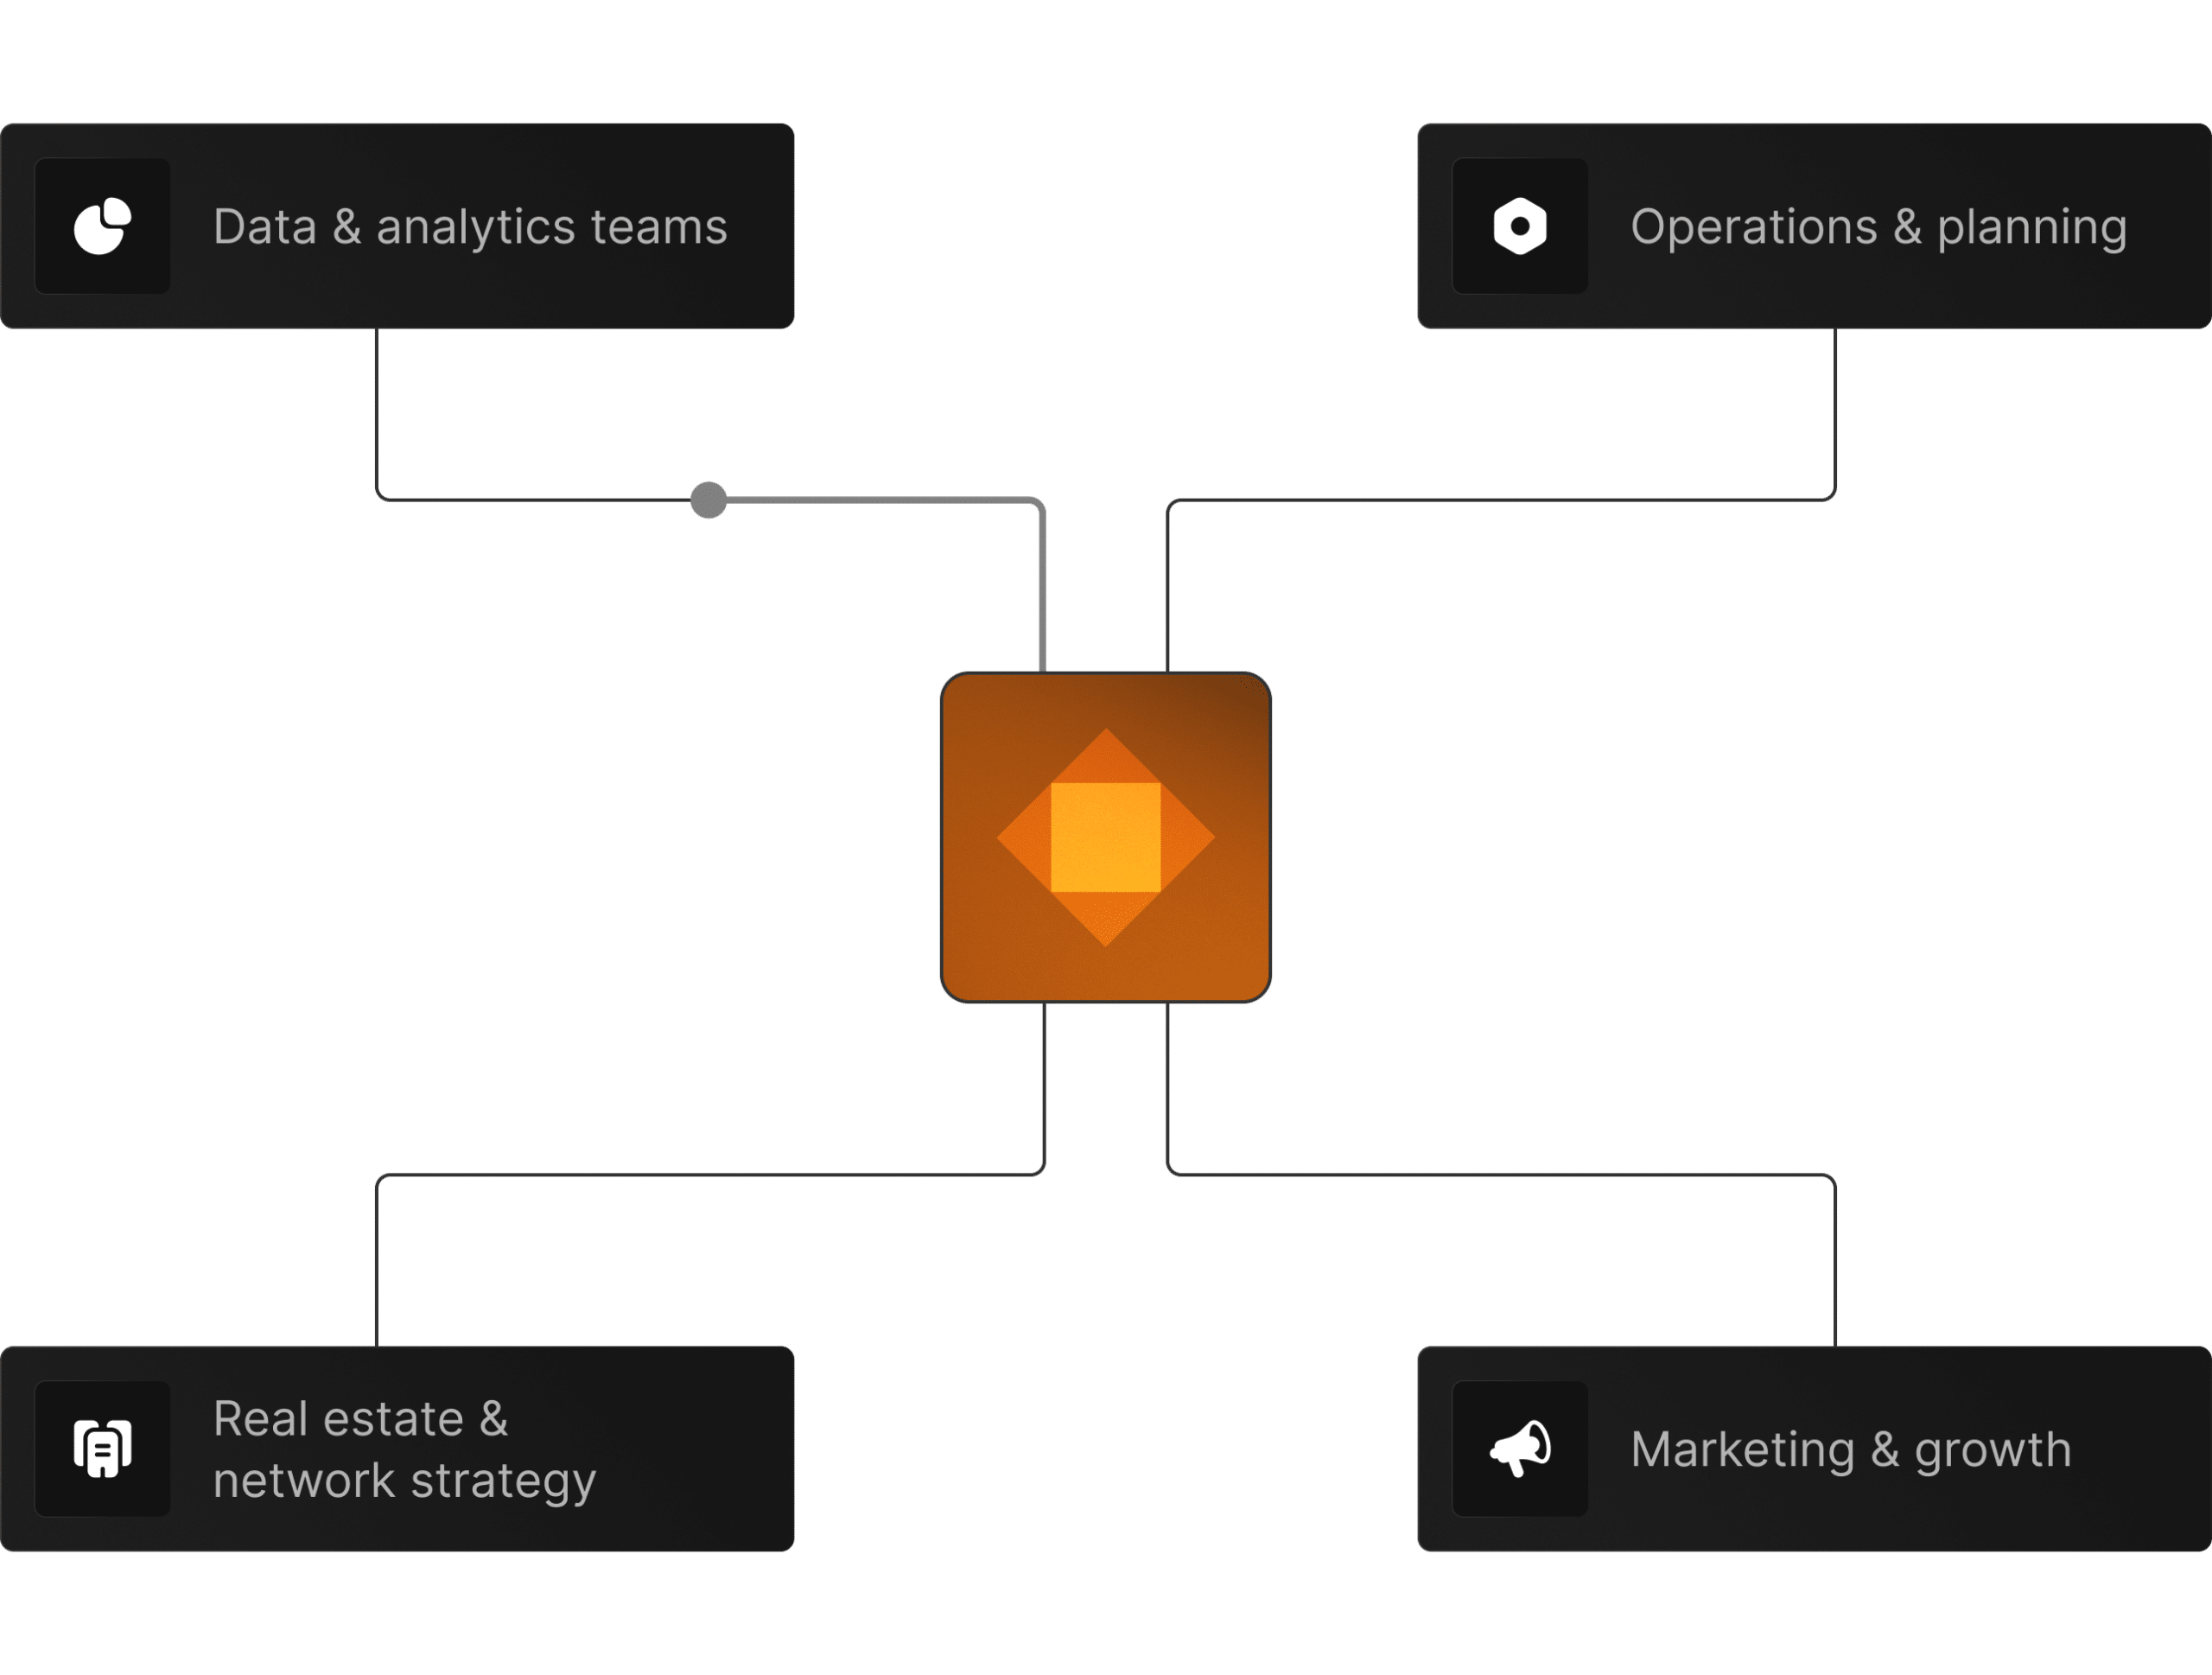
 Data & analytics teams
Looking for clean, reliable visit data to plug into models and dashboards.
 Operations & planning
Owners of staffing, service levels, and store/branch performance.
 Real estate & network strategy
Teams deciding where to open, close, or relocate sites.
 Marketing & growth
Teams that want to put spend where people actually are.


We map Mobility data to your stores, branches, depots, or trade areas.
Explore a few key markets to see how traffic patterns show up for you.
Add locations, use cases, and teams as you see results.
© 2026 Factori. All rights reserved.


