Trusted by

Trusted by
Most inventory plans assume tomorrow will look like yesterday. That breaks down when:
Factori gives you simple, geo‑level datasets that explain why demand changed, so you can:
Align inventory with true local demand drivers, not generic rules of thumb.

Order for promotions and holidays using events, market interest, and historic lift patterns.

Use local affluence, daytime population, and mobility to decide how aggressive to be.

Tune reorder points based on how volatile an area really is.

Test and scale where footfall, interest, and retail spending are already pointing up.

You keep your existing inventory system and forecasts. Factori just feeds them better context.

Adjust base demand by local footfall, economic strength, and market interest.
Stop treating all locations the same; group stores by real‑world context, not just historical volume.
Build simple rules like “when events of this type happen nearby, we lift stock by X% for these categories.”
Test “what if demand softens in these markets?” or “what if we push a new range into these ZIPs?” before committing.
When you miss, quickly see whether the issue was demand, supply, or local conditions.
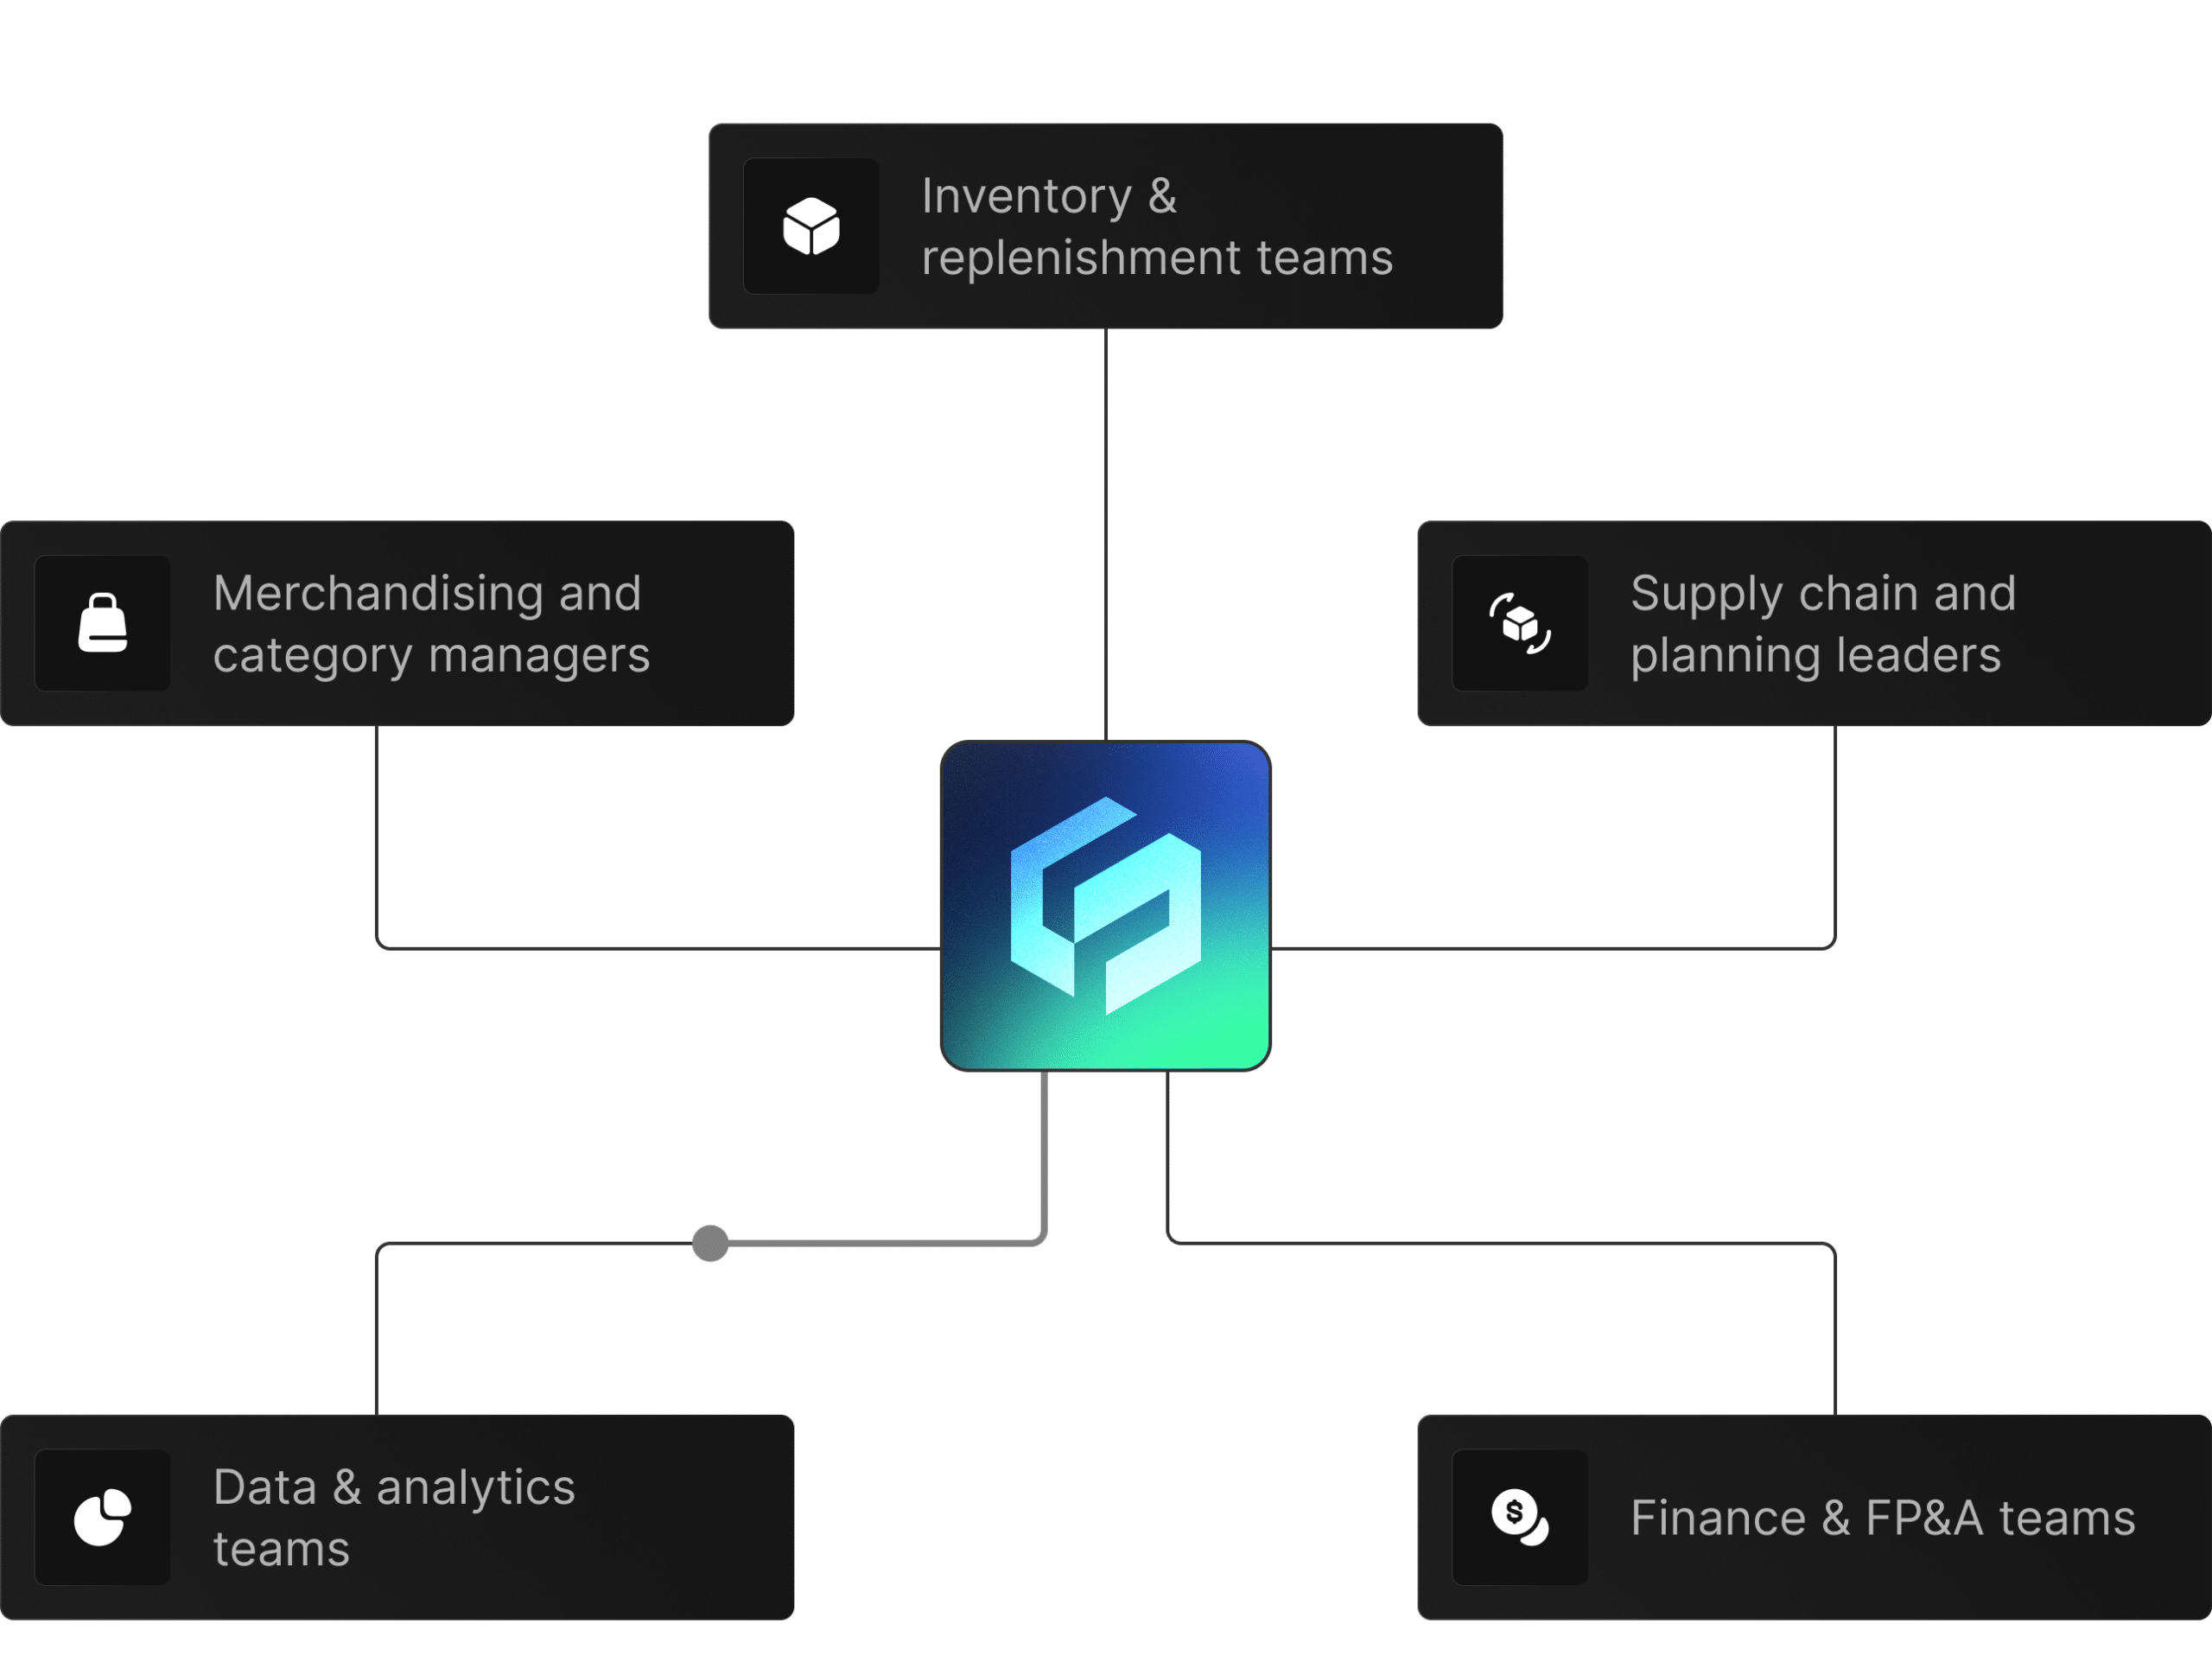
 Inventory & replenishment teams
 Supply chain and planning leaders
 Merchandising and category managers
 Data & analytics teams supporting forecasting and planning
 Finance & FP&A teams reviewing stock and working capital
50–200 stores or a few key regions where inventory pain is real (stockouts, waste, or both).
For example: Mobility + Events + Retail Sales for promos, or People + Economic for pack / mix decisions.
Compare your current plans with “current + Factori data,” and review the changes in stockouts, overstock, and forecast error.
© 2026 Factori. All rights reserved.