Trusted by

Trusted by
Better daily and weekly forecasts for stores, e‑com, and delivery zones.

Smoother, more accurate staffing curves for QSR, retail, branches, and depots.
Tighter ordering and safety stock, especially in volatile or promo‑heavy categories.

A clearer view of what “normal” demand would have been vs. what actually happened.
Factori doesn’t replace your models. It feeds them with th.

Keep your current demand engine, but feed it better inputs.
When you miss, see if events, traffic, or local economics were part of the story.
See which stores or regions react more to income, events, mobility, or promo.
Turn recurring patterns (“rainy Saturdays”, “concert nights”, “new competitor opens”) into simple rules the business can understand.
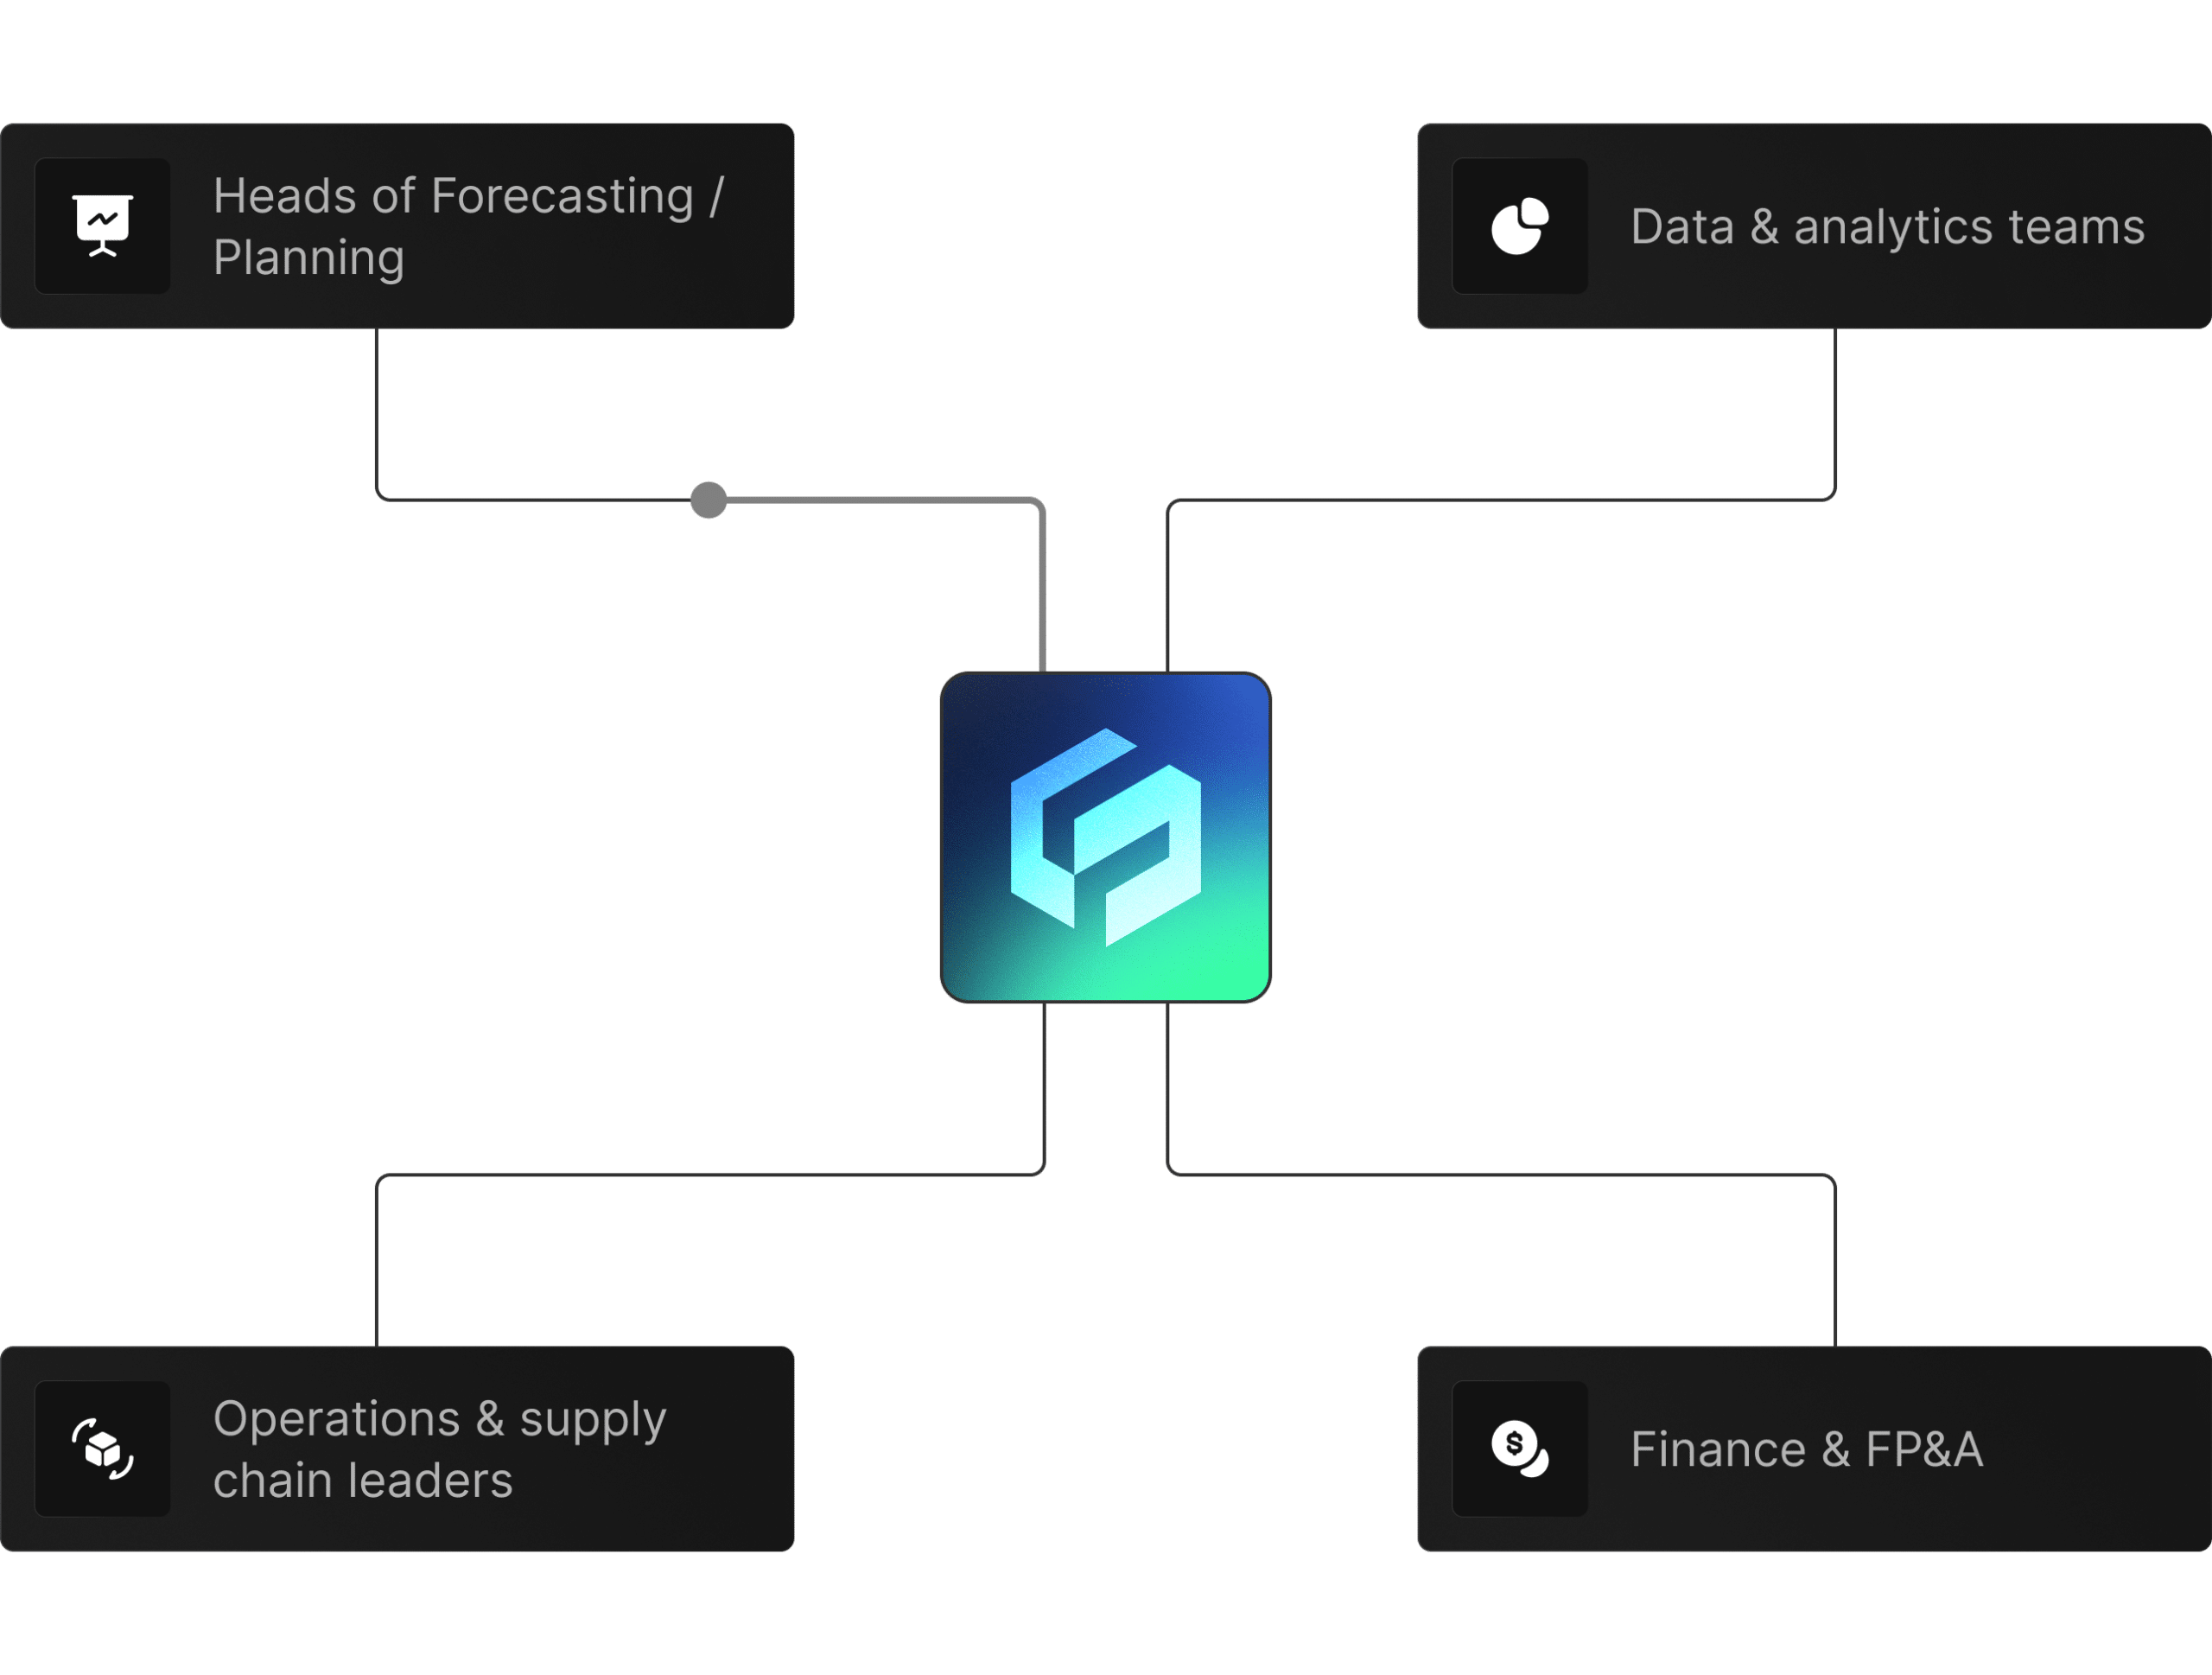
 Heads of Forecasting / Planning
who need error down and trust up.
 Data & analytics teams
who want clean external data without months of wrangling.
 Operations & supply chain leaders
who run staffing, stock, and service levels.
 Finance & FP&A
who need plans grounded in what’s really happening in markets.
50–200 locations or a few key regions, plus 1–2 KPIs (demand, labor, stockouts, etc.).
For example: Mobility + Events + Economic for QSR, or Retail Sales + Market + People for CPG.
Compare your current approach to “current + Factori data” and review the lift and explanations.
© 2026 Factori. All rights reserved.